Assyrian/Chaldean/Syriac vs Bulgarian Disability Age 18 to 34
COMPARE
Assyrian/Chaldean/Syriac
Bulgarian
Disability Age 18 to 34
Disability Age 18 to 34 Comparison
Assyrians/Chaldeans/Syriacs
Bulgarians
6.1%
DISABILITY AGE 18 TO 34
98.9/ 100
METRIC RATING
78th/ 347
METRIC RANK
6.5%
DISABILITY AGE 18 TO 34
78.3/ 100
METRIC RATING
152nd/ 347
METRIC RANK
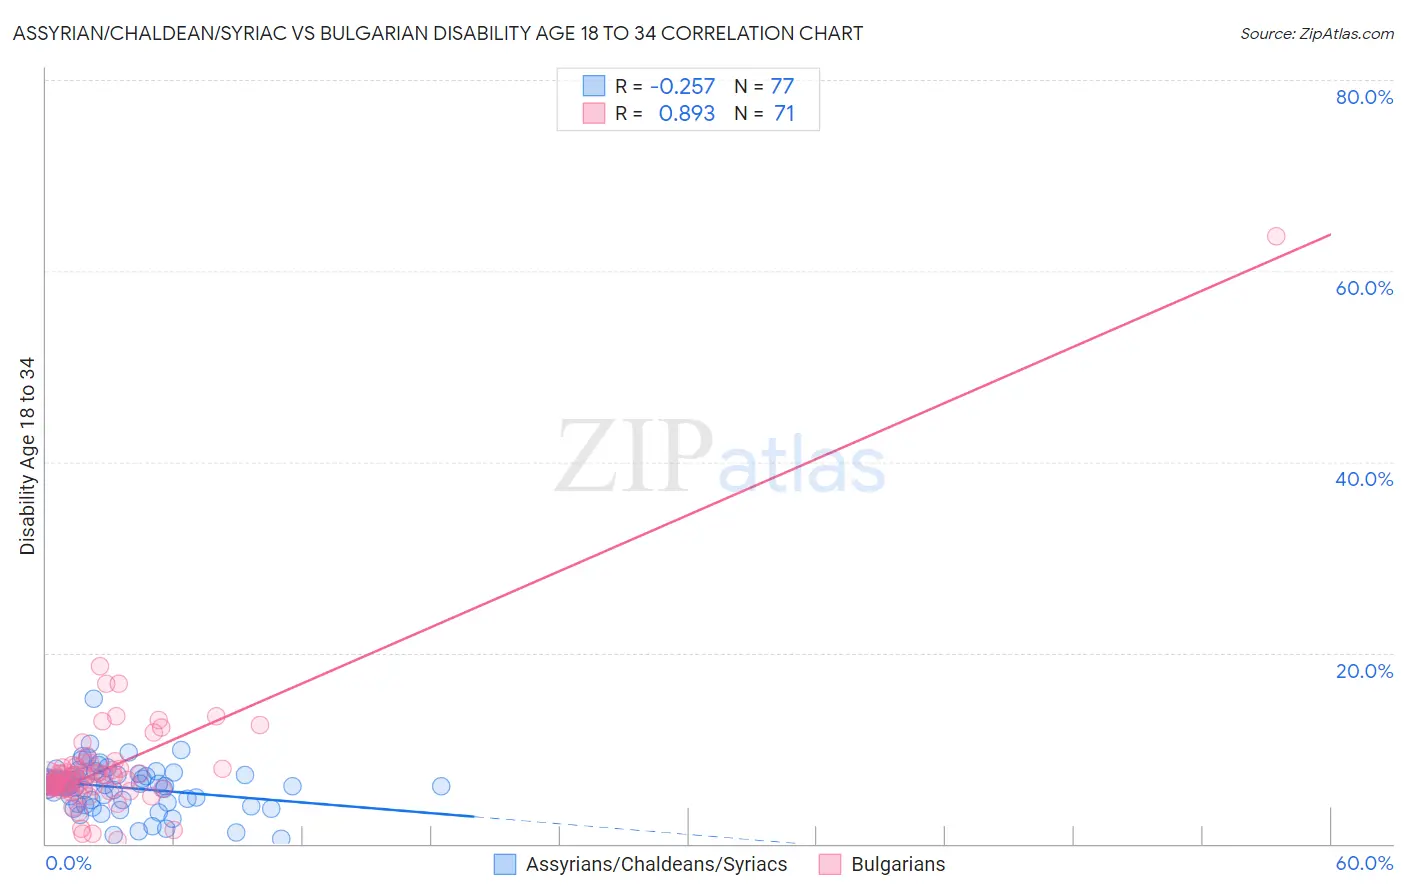
Assyrian/Chaldean/Syriac vs Bulgarian Disability Age 18 to 34 Correlation Chart
The statistical analysis conducted on geographies consisting of 110,269,916 people shows a weak negative correlation between the proportion of Assyrians/Chaldeans/Syriacs and percentage of population with a disability between the ages 18 and 35 in the United States with a correlation coefficient (R) of -0.257 and weighted average of 6.1%. Similarly, the statistical analysis conducted on geographies consisting of 205,383,127 people shows a very strong positive correlation between the proportion of Bulgarians and percentage of population with a disability between the ages 18 and 35 in the United States with a correlation coefficient (R) of 0.893 and weighted average of 6.5%, a difference of 6.0%.
Disability Age 18 to 34 Correlation Summary
| Measurement | Assyrian/Chaldean/Syriac | Bulgarian |
| Minimum | 0.58% | 0.34% |
| Maximum | 15.2% | 63.6% |
| Range | 14.6% | 63.3% |
| Mean | 5.9% | 8.1% |
| Median | 6.1% | 6.7% |
| Interquartile 25% (IQ1) | 4.6% | 5.8% |
| Interquartile 75% (IQ3) | 7.1% | 8.1% |
| Interquartile Range (IQR) | 2.5% | 2.3% |
| Standard Deviation (Sample) | 2.4% | 7.5% |
| Standard Deviation (Population) | 2.3% | 7.5% |
Similar Demographics by Disability Age 18 to 34
Demographics Similar to Assyrians/Chaldeans/Syriacs by Disability Age 18 to 34
In terms of disability age 18 to 34, the demographic groups most similar to Assyrians/Chaldeans/Syriacs are Immigrants from Russia (6.1%, a difference of 0.0%), Immigrants from Western Asia (6.1%, a difference of 0.10%), Afghan (6.1%, a difference of 0.29%), Immigrants from Turkey (6.1%, a difference of 0.38%), and Immigrants from Chile (6.1%, a difference of 0.49%).
| Demographics | Rating | Rank | Disability Age 18 to 34 |
| Immigrants | Japan | 99.3 /100 | #71 | Exceptional 6.0% |
| Immigrants | Lebanon | 99.2 /100 | #72 | Exceptional 6.0% |
| Cypriots | 99.2 /100 | #73 | Exceptional 6.0% |
| Haitians | 99.2 /100 | #74 | Exceptional 6.0% |
| Immigrants | Turkey | 99.1 /100 | #75 | Exceptional 6.1% |
| Immigrants | Western Asia | 98.9 /100 | #76 | Exceptional 6.1% |
| Immigrants | Russia | 98.9 /100 | #77 | Exceptional 6.1% |
| Assyrians/Chaldeans/Syriacs | 98.9 /100 | #78 | Exceptional 6.1% |
| Afghans | 98.7 /100 | #79 | Exceptional 6.1% |
| Immigrants | Chile | 98.5 /100 | #80 | Exceptional 6.1% |
| Immigrants | Australia | 98.5 /100 | #81 | Exceptional 6.1% |
| Immigrants | Northern Africa | 98.4 /100 | #82 | Exceptional 6.1% |
| Barbadians | 98.3 /100 | #83 | Exceptional 6.1% |
| Israelis | 98.3 /100 | #84 | Exceptional 6.1% |
| Immigrants | Ireland | 98.2 /100 | #85 | Exceptional 6.1% |
Demographics Similar to Bulgarians by Disability Age 18 to 34
In terms of disability age 18 to 34, the demographic groups most similar to Bulgarians are Immigrants from Eritrea (6.5%, a difference of 0.090%), Immigrants from Central America (6.5%, a difference of 0.16%), Inupiat (6.5%, a difference of 0.16%), Immigrants from Panama (6.5%, a difference of 0.29%), and Immigrants from Sierra Leone (6.5%, a difference of 0.32%).
| Demographics | Rating | Rank | Disability Age 18 to 34 |
| Moroccans | 85.2 /100 | #145 | Excellent 6.4% |
| Belizeans | 84.9 /100 | #146 | Excellent 6.4% |
| Immigrants | South Africa | 83.7 /100 | #147 | Excellent 6.4% |
| Immigrants | Belgium | 83.5 /100 | #148 | Excellent 6.4% |
| Hondurans | 83.1 /100 | #149 | Excellent 6.4% |
| Immigrants | Dominican Republic | 82.7 /100 | #150 | Excellent 6.4% |
| Tongans | 81.9 /100 | #151 | Excellent 6.4% |
| Bulgarians | 78.3 /100 | #152 | Good 6.5% |
| Immigrants | Eritrea | 77.4 /100 | #153 | Good 6.5% |
| Immigrants | Central America | 76.8 /100 | #154 | Good 6.5% |
| Inupiat | 76.7 /100 | #155 | Good 6.5% |
| Immigrants | Panama | 75.3 /100 | #156 | Good 6.5% |
| Immigrants | Sierra Leone | 75.0 /100 | #157 | Good 6.5% |
| Zimbabweans | 74.7 /100 | #158 | Good 6.5% |
| Dominicans | 73.6 /100 | #159 | Good 6.5% |