Native/Alaskan vs Bulgarian Disability Age 18 to 34
COMPARE
Native/Alaskan
Bulgarian
Disability Age 18 to 34
Disability Age 18 to 34 Comparison
Natives/Alaskans
Bulgarians
8.2%
DISABILITY AGE 18 TO 34
0.0/ 100
METRIC RATING
325th/ 347
METRIC RANK
6.5%
DISABILITY AGE 18 TO 34
78.3/ 100
METRIC RATING
152nd/ 347
METRIC RANK
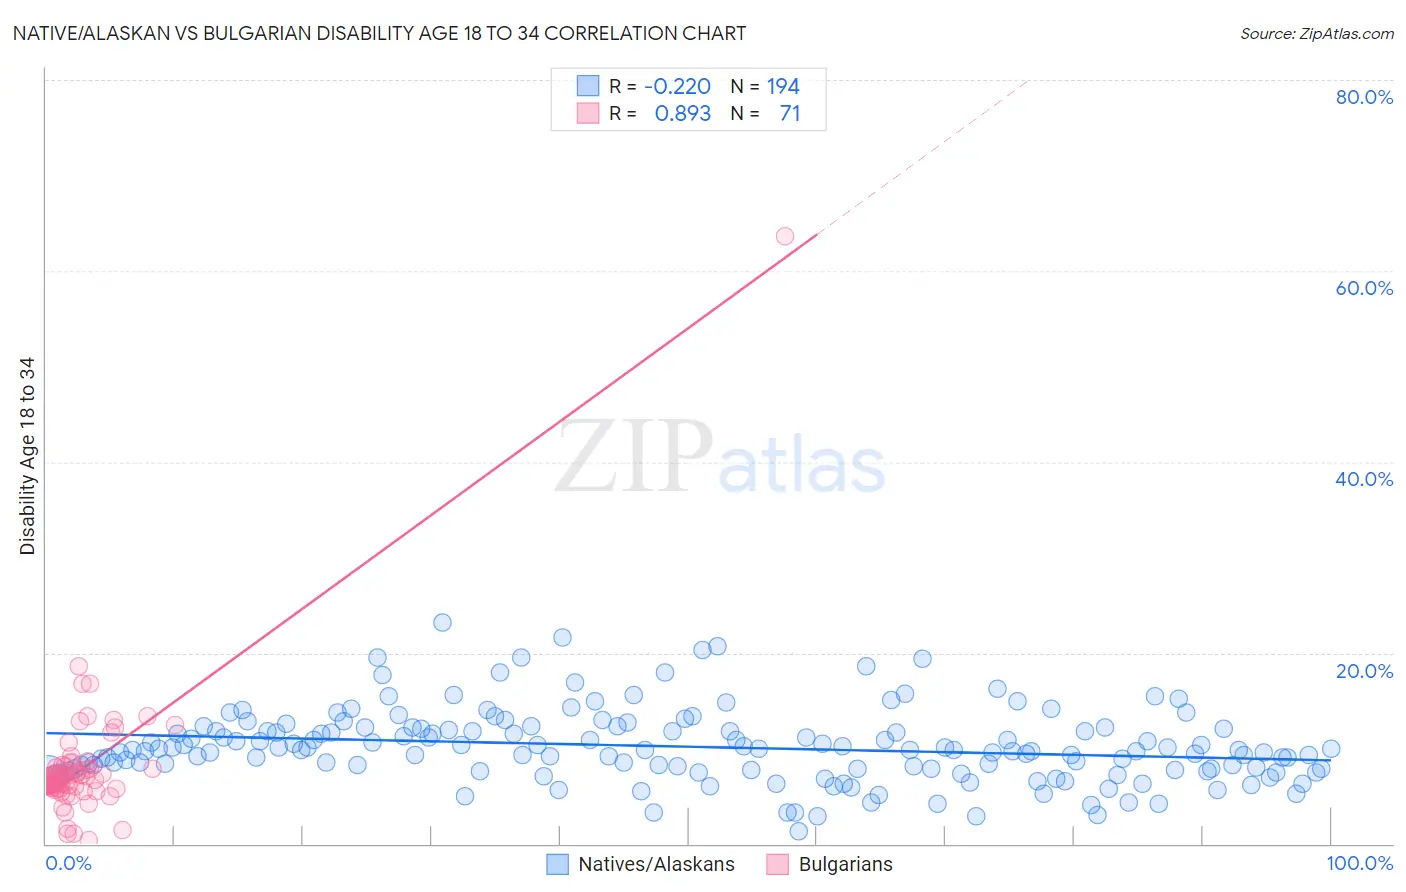
Native/Alaskan vs Bulgarian Disability Age 18 to 34 Correlation Chart
The statistical analysis conducted on geographies consisting of 510,415,530 people shows a weak negative correlation between the proportion of Natives/Alaskans and percentage of population with a disability between the ages 18 and 35 in the United States with a correlation coefficient (R) of -0.220 and weighted average of 8.2%. Similarly, the statistical analysis conducted on geographies consisting of 205,383,127 people shows a very strong positive correlation between the proportion of Bulgarians and percentage of population with a disability between the ages 18 and 35 in the United States with a correlation coefficient (R) of 0.893 and weighted average of 6.5%, a difference of 27.3%.
Disability Age 18 to 34 Correlation Summary
| Measurement | Native/Alaskan | Bulgarian |
| Minimum | 1.4% | 0.34% |
| Maximum | 23.1% | 63.6% |
| Range | 21.8% | 63.3% |
| Mean | 10.2% | 8.1% |
| Median | 9.8% | 6.7% |
| Interquartile 25% (IQ1) | 7.8% | 5.8% |
| Interquartile 75% (IQ3) | 12.1% | 8.1% |
| Interquartile Range (IQR) | 4.2% | 2.3% |
| Standard Deviation (Sample) | 3.8% | 7.5% |
| Standard Deviation (Population) | 3.8% | 7.5% |
Similar Demographics by Disability Age 18 to 34
Demographics Similar to Natives/Alaskans by Disability Age 18 to 34
In terms of disability age 18 to 34, the demographic groups most similar to Natives/Alaskans are Potawatomi (8.2%, a difference of 0.020%), Sioux (8.2%, a difference of 0.14%), Delaware (8.2%, a difference of 0.19%), Cajun (8.2%, a difference of 0.52%), and French American Indian (8.2%, a difference of 0.56%).
| Demographics | Rating | Rank | Disability Age 18 to 34 |
| French Canadians | 0.0 /100 | #318 | Tragic 8.1% |
| Aleuts | 0.0 /100 | #319 | Tragic 8.1% |
| Navajo | 0.0 /100 | #320 | Tragic 8.1% |
| Blackfeet | 0.0 /100 | #321 | Tragic 8.1% |
| Cree | 0.0 /100 | #322 | Tragic 8.1% |
| French American Indians | 0.0 /100 | #323 | Tragic 8.2% |
| Cajuns | 0.0 /100 | #324 | Tragic 8.2% |
| Natives/Alaskans | 0.0 /100 | #325 | Tragic 8.2% |
| Potawatomi | 0.0 /100 | #326 | Tragic 8.2% |
| Sioux | 0.0 /100 | #327 | Tragic 8.2% |
| Delaware | 0.0 /100 | #328 | Tragic 8.2% |
| Crow | 0.0 /100 | #329 | Tragic 8.3% |
| Osage | 0.0 /100 | #330 | Tragic 8.3% |
| Comanche | 0.0 /100 | #331 | Tragic 8.3% |
| Puget Sound Salish | 0.0 /100 | #332 | Tragic 8.3% |
Demographics Similar to Bulgarians by Disability Age 18 to 34
In terms of disability age 18 to 34, the demographic groups most similar to Bulgarians are Immigrants from Eritrea (6.5%, a difference of 0.090%), Immigrants from Central America (6.5%, a difference of 0.16%), Inupiat (6.5%, a difference of 0.16%), Immigrants from Panama (6.5%, a difference of 0.29%), and Immigrants from Sierra Leone (6.5%, a difference of 0.32%).
| Demographics | Rating | Rank | Disability Age 18 to 34 |
| Moroccans | 85.2 /100 | #145 | Excellent 6.4% |
| Belizeans | 84.9 /100 | #146 | Excellent 6.4% |
| Immigrants | South Africa | 83.7 /100 | #147 | Excellent 6.4% |
| Immigrants | Belgium | 83.5 /100 | #148 | Excellent 6.4% |
| Hondurans | 83.1 /100 | #149 | Excellent 6.4% |
| Immigrants | Dominican Republic | 82.7 /100 | #150 | Excellent 6.4% |
| Tongans | 81.9 /100 | #151 | Excellent 6.4% |
| Bulgarians | 78.3 /100 | #152 | Good 6.5% |
| Immigrants | Eritrea | 77.4 /100 | #153 | Good 6.5% |
| Immigrants | Central America | 76.8 /100 | #154 | Good 6.5% |
| Inupiat | 76.7 /100 | #155 | Good 6.5% |
| Immigrants | Panama | 75.3 /100 | #156 | Good 6.5% |
| Immigrants | Sierra Leone | 75.0 /100 | #157 | Good 6.5% |
| Zimbabweans | 74.7 /100 | #158 | Good 6.5% |
| Dominicans | 73.6 /100 | #159 | Good 6.5% |