Scotch-Irish vs Alaskan Athabascan Median Male Earnings
COMPARE
Scotch-Irish
Alaskan Athabascan
Median Male Earnings
Median Male Earnings Comparison
Scotch-Irish
Alaskan Athabascans
$53,658
MEDIAN MALE EARNINGS
30.6/ 100
METRIC RATING
192nd/ 347
METRIC RANK
$49,748
MEDIAN MALE EARNINGS
0.9/ 100
METRIC RATING
255th/ 347
METRIC RANK
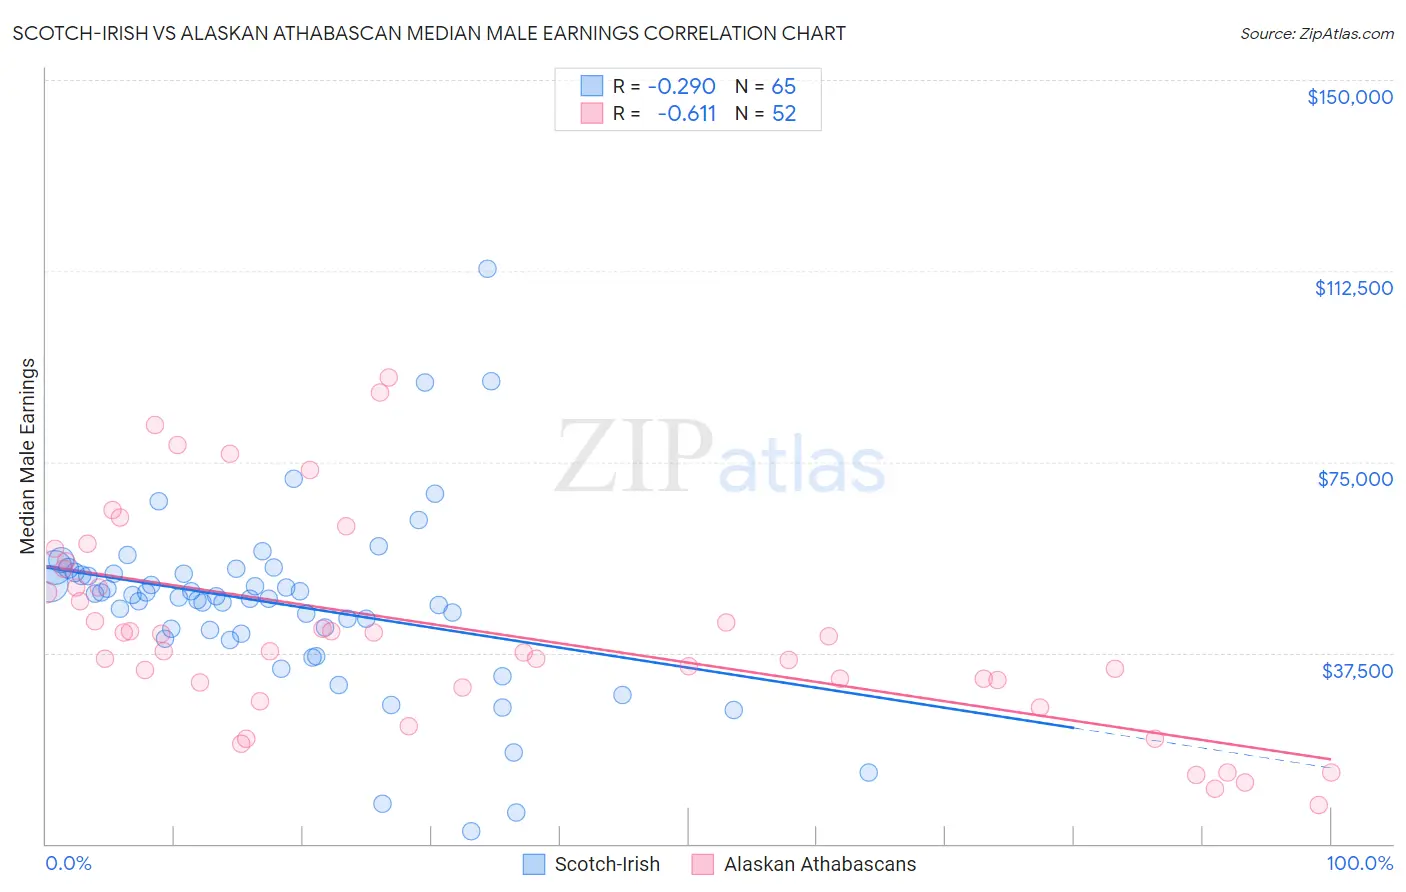
Scotch-Irish vs Alaskan Athabascan Median Male Earnings Correlation Chart
The statistical analysis conducted on geographies consisting of 547,724,250 people shows a weak negative correlation between the proportion of Scotch-Irish and median male earnings in the United States with a correlation coefficient (R) of -0.290 and weighted average of $53,658. Similarly, the statistical analysis conducted on geographies consisting of 45,804,380 people shows a significant negative correlation between the proportion of Alaskan Athabascans and median male earnings in the United States with a correlation coefficient (R) of -0.611 and weighted average of $49,748, a difference of 7.9%.
Median Male Earnings Correlation Summary
| Measurement | Scotch-Irish | Alaskan Athabascan |
| Minimum | $2,499 | $7,708 |
| Maximum | $113,000 | $91,667 |
| Range | $110,501 | $83,959 |
| Mean | $47,040 | $41,933 |
| Median | $48,432 | $39,323 |
| Interquartile 25% (IQ1) | $40,813 | $31,226 |
| Interquartile 75% (IQ3) | $53,223 | $52,255 |
| Interquartile Range (IQR) | $12,411 | $21,029 |
| Standard Deviation (Sample) | $17,914 | $20,193 |
| Standard Deviation (Population) | $17,776 | $19,997 |
Similar Demographics by Median Male Earnings
Demographics Similar to Scotch-Irish by Median Male Earnings
In terms of median male earnings, the demographic groups most similar to Scotch-Irish are Guamanian/Chamorro ($53,661, a difference of 0.010%), Kenyan ($53,647, a difference of 0.020%), Uruguayan ($53,680, a difference of 0.040%), Puget Sound Salish ($53,704, a difference of 0.090%), and Immigrants from Eastern Africa ($53,713, a difference of 0.10%).
| Demographics | Rating | Rank | Median Male Earnings |
| Immigrants | Sierra Leone | 36.0 /100 | #185 | Fair $53,905 |
| Colombians | 34.4 /100 | #186 | Fair $53,832 |
| Immigrants | Eritrea | 31.8 /100 | #187 | Fair $53,715 |
| Immigrants | Eastern Africa | 31.8 /100 | #188 | Fair $53,713 |
| Puget Sound Salish | 31.6 /100 | #189 | Fair $53,704 |
| Uruguayans | 31.1 /100 | #190 | Fair $53,680 |
| Guamanians/Chamorros | 30.7 /100 | #191 | Fair $53,661 |
| Scotch-Irish | 30.6 /100 | #192 | Fair $53,658 |
| Kenyans | 30.4 /100 | #193 | Fair $53,647 |
| Spanish | 29.0 /100 | #194 | Fair $53,576 |
| Immigrants | Azores | 27.5 /100 | #195 | Fair $53,503 |
| Immigrants | Africa | 26.6 /100 | #196 | Fair $53,457 |
| Immigrants | Kenya | 26.0 /100 | #197 | Fair $53,427 |
| Immigrants | Costa Rica | 22.6 /100 | #198 | Fair $53,237 |
| Tongans | 22.3 /100 | #199 | Fair $53,218 |
Demographics Similar to Alaskan Athabascans by Median Male Earnings
In terms of median male earnings, the demographic groups most similar to Alaskan Athabascans are Senegalese ($49,774, a difference of 0.050%), Alaska Native ($49,711, a difference of 0.070%), British West Indian ($49,636, a difference of 0.23%), German Russian ($49,924, a difference of 0.35%), and Cree ($49,497, a difference of 0.51%).
| Demographics | Rating | Rank | Median Male Earnings |
| Immigrants | Guyana | 1.6 /100 | #248 | Tragic $50,321 |
| Immigrants | Burma/Myanmar | 1.6 /100 | #249 | Tragic $50,298 |
| Osage | 1.6 /100 | #250 | Tragic $50,292 |
| Immigrants | Grenada | 1.6 /100 | #251 | Tragic $50,279 |
| Immigrants | Cabo Verde | 1.2 /100 | #252 | Tragic $50,009 |
| German Russians | 1.1 /100 | #253 | Tragic $49,924 |
| Senegalese | 1.0 /100 | #254 | Tragic $49,774 |
| Alaskan Athabascans | 0.9 /100 | #255 | Tragic $49,748 |
| Alaska Natives | 0.9 /100 | #256 | Tragic $49,711 |
| British West Indians | 0.8 /100 | #257 | Tragic $49,636 |
| Cree | 0.7 /100 | #258 | Tragic $49,497 |
| Nepalese | 0.7 /100 | #259 | Tragic $49,458 |
| Iroquois | 0.7 /100 | #260 | Tragic $49,374 |
| Liberians | 0.6 /100 | #261 | Tragic $49,318 |
| Immigrants | West Indies | 0.6 /100 | #262 | Tragic $49,271 |