Scotch-Irish vs Alaskan Athabascan GED/Equivalency
COMPARE
Scotch-Irish
Alaskan Athabascan
GED/Equivalency
GED/Equivalency Comparison
Scotch-Irish
Alaskan Athabascans
86.8%
GED/EQUIVALENCY
91.6/ 100
METRIC RATING
120th/ 347
METRIC RANK
85.3%
GED/EQUIVALENCY
27.5/ 100
METRIC RATING
190th/ 347
METRIC RANK
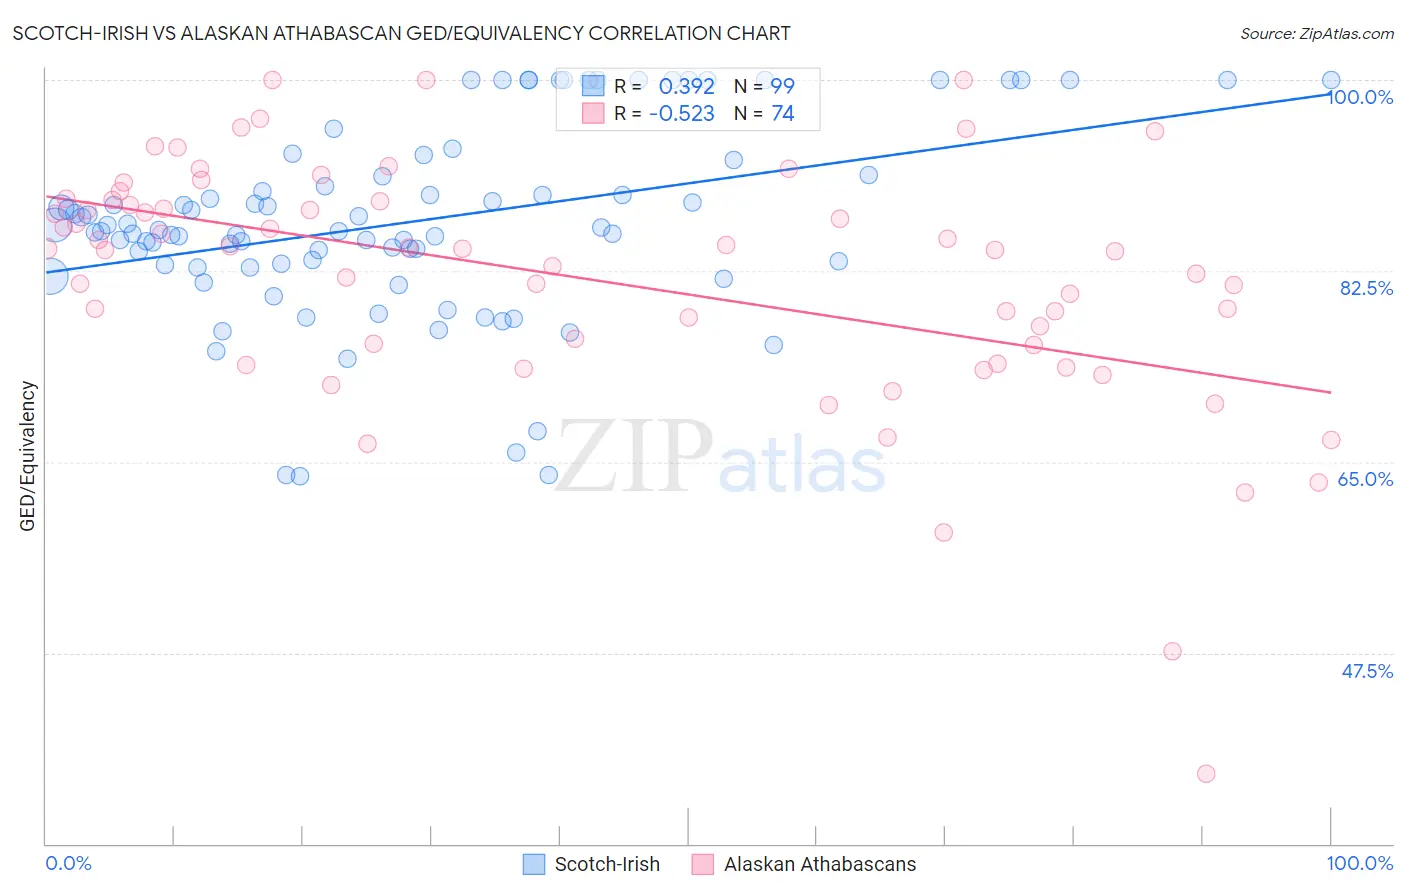
Scotch-Irish vs Alaskan Athabascan GED/Equivalency Correlation Chart
The statistical analysis conducted on geographies consisting of 548,780,564 people shows a mild positive correlation between the proportion of Scotch-Irish and percentage of population with at least ged/equivalency education in the United States with a correlation coefficient (R) of 0.392 and weighted average of 86.8%. Similarly, the statistical analysis conducted on geographies consisting of 45,820,221 people shows a substantial negative correlation between the proportion of Alaskan Athabascans and percentage of population with at least ged/equivalency education in the United States with a correlation coefficient (R) of -0.523 and weighted average of 85.3%, a difference of 1.7%.
GED/Equivalency Correlation Summary
| Measurement | Scotch-Irish | Alaskan Athabascan |
| Minimum | 63.7% | 36.4% |
| Maximum | 100.0% | 100.0% |
| Range | 36.3% | 63.6% |
| Mean | 87.0% | 81.7% |
| Median | 86.2% | 84.5% |
| Interquartile 25% (IQ1) | 83.1% | 75.7% |
| Interquartile 75% (IQ3) | 91.3% | 88.9% |
| Interquartile Range (IQR) | 8.2% | 13.2% |
| Standard Deviation (Sample) | 8.7% | 11.4% |
| Standard Deviation (Population) | 8.7% | 11.3% |
Similar Demographics by GED/Equivalency
Demographics Similar to Scotch-Irish by GED/Equivalency
In terms of ged/equivalency, the demographic groups most similar to Scotch-Irish are Immigrants from Lebanon (86.8%, a difference of 0.050%), Immigrants from Jordan (86.8%, a difference of 0.050%), Immigrants from Italy (86.7%, a difference of 0.070%), Immigrants from Egypt (86.7%, a difference of 0.080%), and Celtic (86.7%, a difference of 0.080%).
| Demographics | Rating | Rank | GED/Equivalency |
| Assyrians/Chaldeans/Syriacs | 94.8 /100 | #113 | Exceptional 87.0% |
| Immigrants | Kazakhstan | 94.7 /100 | #114 | Exceptional 87.0% |
| Mongolians | 94.6 /100 | #115 | Exceptional 87.0% |
| Swiss | 94.5 /100 | #116 | Exceptional 87.0% |
| Immigrants | Hong Kong | 93.8 /100 | #117 | Exceptional 86.9% |
| French Canadians | 93.2 /100 | #118 | Exceptional 86.9% |
| Immigrants | China | 93.2 /100 | #119 | Exceptional 86.9% |
| Scotch-Irish | 91.6 /100 | #120 | Exceptional 86.8% |
| Immigrants | Lebanon | 90.9 /100 | #121 | Exceptional 86.8% |
| Immigrants | Jordan | 90.8 /100 | #122 | Exceptional 86.8% |
| Immigrants | Italy | 90.5 /100 | #123 | Exceptional 86.7% |
| Immigrants | Egypt | 90.4 /100 | #124 | Exceptional 86.7% |
| Celtics | 90.4 /100 | #125 | Exceptional 86.7% |
| Asians | 90.3 /100 | #126 | Exceptional 86.7% |
| Argentineans | 89.7 /100 | #127 | Excellent 86.7% |
Demographics Similar to Alaskan Athabascans by GED/Equivalency
In terms of ged/equivalency, the demographic groups most similar to Alaskan Athabascans are Guamanian/Chamorro (85.3%, a difference of 0.020%), Immigrants from Sierra Leone (85.4%, a difference of 0.040%), Immigrants from Afghanistan (85.4%, a difference of 0.060%), Spaniard (85.4%, a difference of 0.11%), and Spanish (85.4%, a difference of 0.13%).
| Demographics | Rating | Rank | GED/Equivalency |
| Immigrants | Sudan | 34.2 /100 | #183 | Fair 85.5% |
| Immigrants | Oceania | 33.6 /100 | #184 | Fair 85.5% |
| Spanish | 32.8 /100 | #185 | Fair 85.4% |
| Spaniards | 31.9 /100 | #186 | Fair 85.4% |
| Immigrants | Afghanistan | 29.8 /100 | #187 | Fair 85.4% |
| Immigrants | Sierra Leone | 29.0 /100 | #188 | Fair 85.4% |
| Guamanians/Chamorros | 28.4 /100 | #189 | Fair 85.3% |
| Alaskan Athabascans | 27.5 /100 | #190 | Fair 85.3% |
| South American Indians | 22.8 /100 | #191 | Fair 85.2% |
| Immigrants | Nonimmigrants | 22.7 /100 | #192 | Fair 85.2% |
| Delaware | 22.2 /100 | #193 | Fair 85.2% |
| Puget Sound Salish | 20.8 /100 | #194 | Fair 85.2% |
| Chippewa | 20.8 /100 | #195 | Fair 85.2% |
| Tongans | 20.7 /100 | #196 | Fair 85.2% |
| Costa Ricans | 20.4 /100 | #197 | Fair 85.2% |