English vs Dominican Self-Care Disability
COMPARE
English
Dominican
Self-Care Disability
Self-Care Disability Comparison
English
Dominicans
2.5%
SELF-CARE DISABILITY
46.2/ 100
METRIC RATING
178th/ 347
METRIC RANK
3.1%
SELF-CARE DISABILITY
0.0/ 100
METRIC RATING
341st/ 347
METRIC RANK
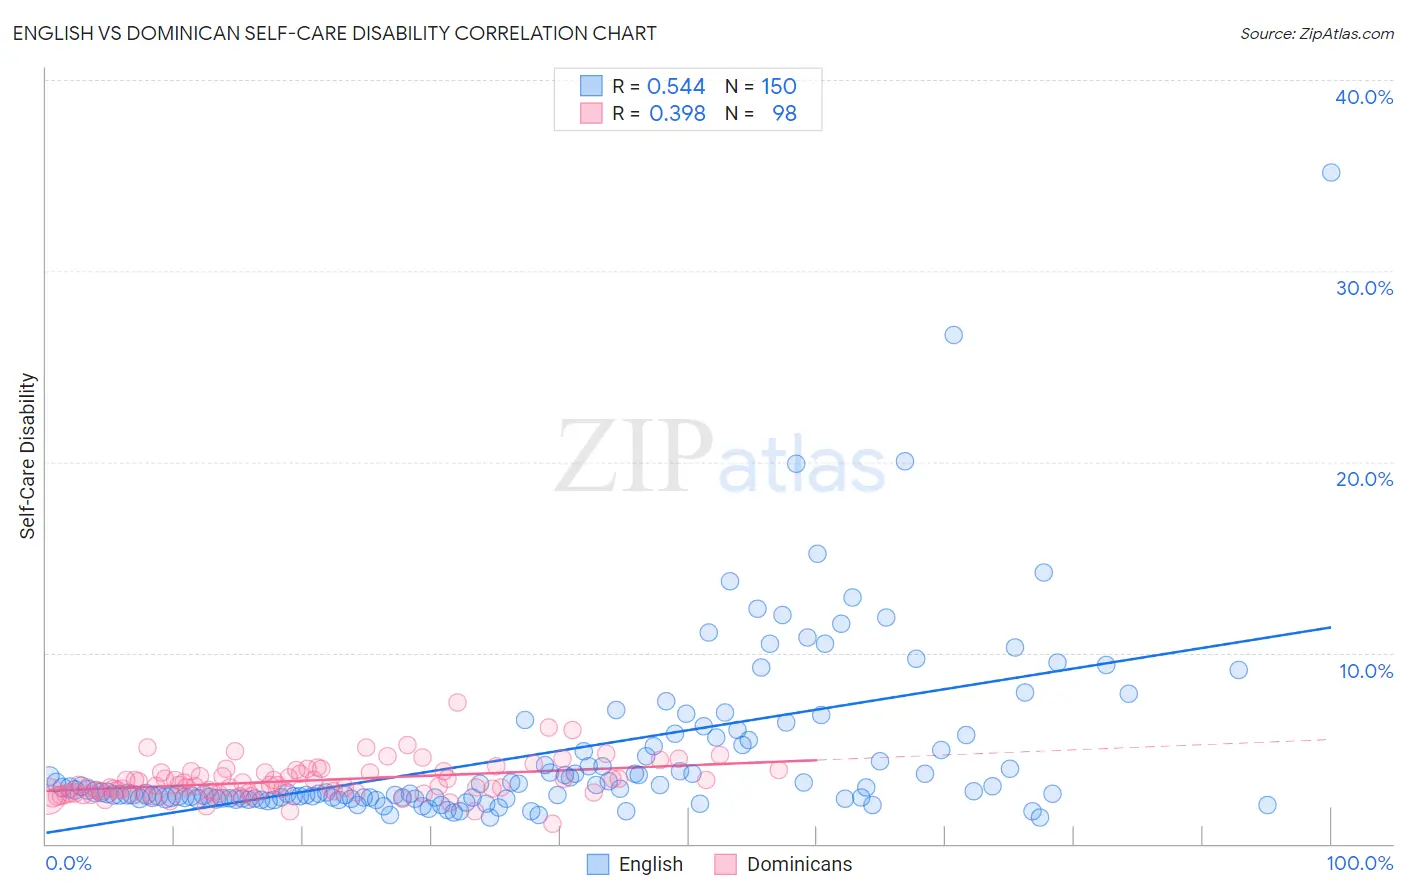
English vs Dominican Self-Care Disability Correlation Chart
The statistical analysis conducted on geographies consisting of 576,680,269 people shows a substantial positive correlation between the proportion of English and percentage of population with self-care disability in the United States with a correlation coefficient (R) of 0.544 and weighted average of 2.5%. Similarly, the statistical analysis conducted on geographies consisting of 354,514,623 people shows a mild positive correlation between the proportion of Dominicans and percentage of population with self-care disability in the United States with a correlation coefficient (R) of 0.398 and weighted average of 3.1%, a difference of 24.0%.
Self-Care Disability Correlation Summary
| Measurement | English | Dominican |
| Minimum | 1.4% | 1.0% |
| Maximum | 35.1% | 7.4% |
| Range | 33.8% | 6.3% |
| Mean | 4.7% | 3.3% |
| Median | 2.7% | 3.0% |
| Interquartile 25% (IQ1) | 2.4% | 2.7% |
| Interquartile 75% (IQ3) | 5.2% | 3.7% |
| Interquartile Range (IQR) | 2.8% | 1.1% |
| Standard Deviation (Sample) | 4.7% | 0.96% |
| Standard Deviation (Population) | 4.7% | 0.96% |
Similar Demographics by Self-Care Disability
Demographics Similar to English by Self-Care Disability
In terms of self-care disability, the demographic groups most similar to English are Immigrants from Kazakhstan (2.5%, a difference of 0.020%), Hungarian (2.5%, a difference of 0.030%), Immigrants from Afghanistan (2.5%, a difference of 0.070%), Immigrants from Bosnia and Herzegovina (2.5%, a difference of 0.16%), and Welsh (2.5%, a difference of 0.18%).
| Demographics | Rating | Rank | Self-Care Disability |
| Pennsylvania Germans | 53.5 /100 | #171 | Average 2.5% |
| Czechoslovakians | 53.5 /100 | #172 | Average 2.5% |
| Immigrants | Burma/Myanmar | 52.8 /100 | #173 | Average 2.5% |
| Welsh | 50.0 /100 | #174 | Average 2.5% |
| Immigrants | Bosnia and Herzegovina | 49.6 /100 | #175 | Average 2.5% |
| Immigrants | Afghanistan | 47.6 /100 | #176 | Average 2.5% |
| Immigrants | Kazakhstan | 46.7 /100 | #177 | Average 2.5% |
| English | 46.2 /100 | #178 | Average 2.5% |
| Hungarians | 45.5 /100 | #179 | Average 2.5% |
| Indonesians | 41.2 /100 | #180 | Average 2.5% |
| Ghanaians | 40.4 /100 | #181 | Average 2.5% |
| Maltese | 37.5 /100 | #182 | Fair 2.5% |
| Salvadorans | 36.4 /100 | #183 | Fair 2.5% |
| Yugoslavians | 36.1 /100 | #184 | Fair 2.5% |
| Slavs | 34.3 /100 | #185 | Fair 2.5% |
Demographics Similar to Dominicans by Self-Care Disability
In terms of self-care disability, the demographic groups most similar to Dominicans are Immigrants from Cabo Verde (3.1%, a difference of 0.26%), Immigrants from Dominican Republic (3.0%, a difference of 0.59%), Cape Verdean (3.0%, a difference of 0.98%), Choctaw (3.0%, a difference of 1.3%), and Colville (3.1%, a difference of 1.6%).
| Demographics | Rating | Rank | Self-Care Disability |
| Dutch West Indians | 0.0 /100 | #333 | Tragic 3.0% |
| Houma | 0.0 /100 | #334 | Tragic 3.0% |
| Immigrants | Azores | 0.0 /100 | #335 | Tragic 3.0% |
| Immigrants | Yemen | 0.0 /100 | #336 | Tragic 3.0% |
| Choctaw | 0.0 /100 | #337 | Tragic 3.0% |
| Cape Verdeans | 0.0 /100 | #338 | Tragic 3.0% |
| Immigrants | Dominican Republic | 0.0 /100 | #339 | Tragic 3.0% |
| Immigrants | Cabo Verde | 0.0 /100 | #340 | Tragic 3.1% |
| Dominicans | 0.0 /100 | #341 | Tragic 3.1% |
| Colville | 0.0 /100 | #342 | Tragic 3.1% |
| Tohono O'odham | 0.0 /100 | #343 | Tragic 3.1% |
| Pueblo | 0.0 /100 | #344 | Tragic 3.3% |
| Armenians | 0.0 /100 | #345 | Tragic 3.4% |
| Puerto Ricans | 0.0 /100 | #346 | Tragic 3.7% |
| Immigrants | Armenia | 0.0 /100 | #347 | Tragic 4.2% |