Latvian vs British Self-Care Disability
COMPARE
Latvian
British
Self-Care Disability
Self-Care Disability Comparison
Latvians
British
2.3%
SELF-CARE DISABILITY
99.7/ 100
METRIC RATING
49th/ 347
METRIC RANK
2.4%
SELF-CARE DISABILITY
94.3/ 100
METRIC RATING
107th/ 347
METRIC RANK
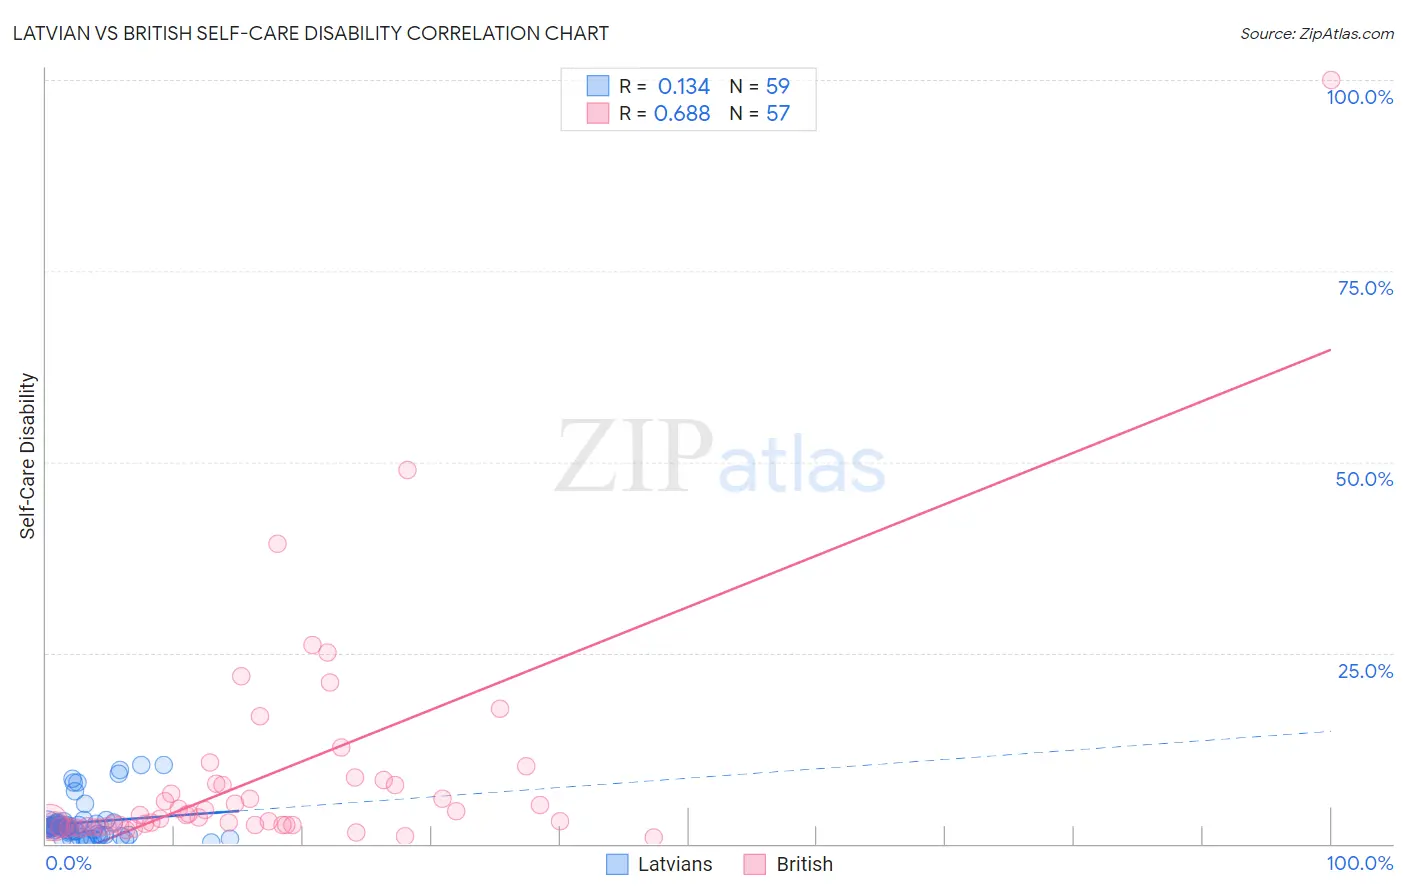
Latvian vs British Self-Care Disability Correlation Chart
The statistical analysis conducted on geographies consisting of 220,536,730 people shows a poor positive correlation between the proportion of Latvians and percentage of population with self-care disability in the United States with a correlation coefficient (R) of 0.134 and weighted average of 2.3%. Similarly, the statistical analysis conducted on geographies consisting of 530,052,811 people shows a significant positive correlation between the proportion of British and percentage of population with self-care disability in the United States with a correlation coefficient (R) of 0.688 and weighted average of 2.4%, a difference of 3.8%.
Self-Care Disability Correlation Summary
| Measurement | Latvian | British |
| Minimum | 0.23% | 0.87% |
| Maximum | 10.4% | 100.0% |
| Range | 10.1% | 99.1% |
| Mean | 2.8% | 9.0% |
| Median | 2.2% | 3.7% |
| Interquartile 25% (IQ1) | 1.2% | 2.4% |
| Interquartile 75% (IQ3) | 2.8% | 8.0% |
| Interquartile Range (IQR) | 1.6% | 5.6% |
| Standard Deviation (Sample) | 2.6% | 15.4% |
| Standard Deviation (Population) | 2.6% | 15.3% |
Similar Demographics by Self-Care Disability
Demographics Similar to Latvians by Self-Care Disability
In terms of self-care disability, the demographic groups most similar to Latvians are Immigrants from Brazil (2.3%, a difference of 0.020%), Immigrants from Malaysia (2.3%, a difference of 0.17%), Kenyan (2.3%, a difference of 0.17%), Immigrants from Serbia (2.3%, a difference of 0.19%), and Jordanian (2.3%, a difference of 0.22%).
| Demographics | Rating | Rank | Self-Care Disability |
| Immigrants | Uganda | 99.8 /100 | #42 | Exceptional 2.3% |
| Immigrants | Pakistan | 99.8 /100 | #43 | Exceptional 2.3% |
| Immigrants | South Africa | 99.8 /100 | #44 | Exceptional 2.3% |
| Norwegians | 99.8 /100 | #45 | Exceptional 2.3% |
| Czechs | 99.8 /100 | #46 | Exceptional 2.3% |
| Jordanians | 99.7 /100 | #47 | Exceptional 2.3% |
| Immigrants | Malaysia | 99.7 /100 | #48 | Exceptional 2.3% |
| Latvians | 99.7 /100 | #49 | Exceptional 2.3% |
| Immigrants | Brazil | 99.7 /100 | #50 | Exceptional 2.3% |
| Kenyans | 99.7 /100 | #51 | Exceptional 2.3% |
| Immigrants | Serbia | 99.6 /100 | #52 | Exceptional 2.3% |
| Australians | 99.6 /100 | #53 | Exceptional 2.3% |
| Argentineans | 99.6 /100 | #54 | Exceptional 2.3% |
| Immigrants | France | 99.6 /100 | #55 | Exceptional 2.3% |
| Immigrants | Eastern Asia | 99.6 /100 | #56 | Exceptional 2.3% |
Demographics Similar to British by Self-Care Disability
In terms of self-care disability, the demographic groups most similar to British are Immigrants from Indonesia (2.4%, a difference of 0.010%), Carpatho Rusyn (2.4%, a difference of 0.020%), Greek (2.4%, a difference of 0.030%), Slovene (2.4%, a difference of 0.040%), and Bhutanese (2.4%, a difference of 0.050%).
| Demographics | Rating | Rank | Self-Care Disability |
| Europeans | 95.8 /100 | #100 | Exceptional 2.4% |
| Immigrants | Scotland | 95.7 /100 | #101 | Exceptional 2.4% |
| Croatians | 95.0 /100 | #102 | Exceptional 2.4% |
| Alsatians | 94.9 /100 | #103 | Exceptional 2.4% |
| Bhutanese | 94.5 /100 | #104 | Exceptional 2.4% |
| Carpatho Rusyns | 94.4 /100 | #105 | Exceptional 2.4% |
| Immigrants | Indonesia | 94.3 /100 | #106 | Exceptional 2.4% |
| British | 94.3 /100 | #107 | Exceptional 2.4% |
| Greeks | 94.1 /100 | #108 | Exceptional 2.4% |
| Slovenes | 94.1 /100 | #109 | Exceptional 2.4% |
| Immigrants | Africa | 93.7 /100 | #110 | Exceptional 2.4% |
| Serbians | 93.6 /100 | #111 | Exceptional 2.4% |
| Scandinavians | 93.5 /100 | #112 | Exceptional 2.4% |
| South Americans | 93.2 /100 | #113 | Exceptional 2.4% |
| Immigrants | North Macedonia | 93.1 /100 | #114 | Exceptional 2.4% |