Salvadoran vs Immigrants from Oceania Ambulatory Disability
COMPARE
Salvadoran
Immigrants from Oceania
Ambulatory Disability
Ambulatory Disability Comparison
Salvadorans
Immigrants from Oceania
5.8%
AMBULATORY DISABILITY
98.4/ 100
METRIC RATING
96th/ 347
METRIC RANK
6.1%
AMBULATORY DISABILITY
60.7/ 100
METRIC RATING
167th/ 347
METRIC RANK
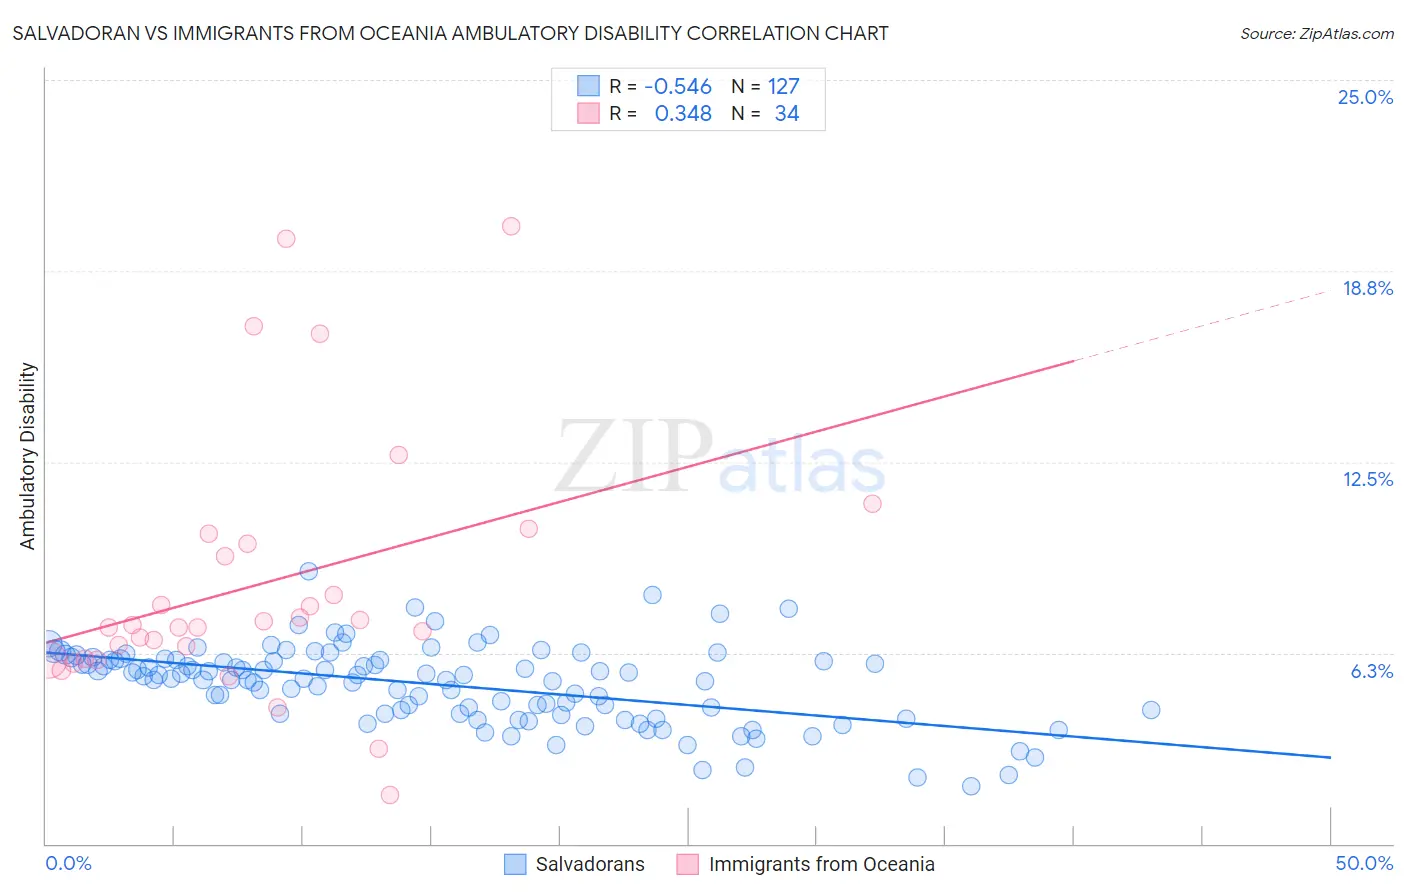
Salvadoran vs Immigrants from Oceania Ambulatory Disability Correlation Chart
The statistical analysis conducted on geographies consisting of 398,824,360 people shows a substantial negative correlation between the proportion of Salvadorans and percentage of population with ambulatory disability in the United States with a correlation coefficient (R) of -0.546 and weighted average of 5.8%. Similarly, the statistical analysis conducted on geographies consisting of 305,408,228 people shows a mild positive correlation between the proportion of Immigrants from Oceania and percentage of population with ambulatory disability in the United States with a correlation coefficient (R) of 0.348 and weighted average of 6.1%, a difference of 5.1%.
Ambulatory Disability Correlation Summary
| Measurement | Salvadoran | Immigrants from Oceania |
| Minimum | 1.9% | 1.6% |
| Maximum | 8.9% | 20.2% |
| Range | 7.0% | 18.6% |
| Mean | 5.2% | 8.5% |
| Median | 5.5% | 7.1% |
| Interquartile 25% (IQ1) | 4.3% | 6.1% |
| Interquartile 75% (IQ3) | 6.0% | 9.8% |
| Interquartile Range (IQR) | 1.8% | 3.8% |
| Standard Deviation (Sample) | 1.3% | 4.3% |
| Standard Deviation (Population) | 1.3% | 4.2% |
Similar Demographics by Ambulatory Disability
Demographics Similar to Salvadorans by Ambulatory Disability
In terms of ambulatory disability, the demographic groups most similar to Salvadorans are Immigrants from El Salvador (5.8%, a difference of 0.020%), Immigrants from Somalia (5.8%, a difference of 0.040%), Kenyan (5.8%, a difference of 0.060%), Immigrants from Lebanon (5.8%, a difference of 0.070%), and Immigrants from Northern Europe (5.8%, a difference of 0.15%).
| Demographics | Rating | Rank | Ambulatory Disability |
| Bhutanese | 98.8 /100 | #89 | Exceptional 5.8% |
| Australians | 98.8 /100 | #90 | Exceptional 5.8% |
| Immigrants | Sudan | 98.8 /100 | #91 | Exceptional 5.8% |
| Immigrants | Sierra Leone | 98.6 /100 | #92 | Exceptional 5.8% |
| Immigrants | Denmark | 98.6 /100 | #93 | Exceptional 5.8% |
| Kenyans | 98.4 /100 | #94 | Exceptional 5.8% |
| Immigrants | El Salvador | 98.4 /100 | #95 | Exceptional 5.8% |
| Salvadorans | 98.4 /100 | #96 | Exceptional 5.8% |
| Immigrants | Somalia | 98.3 /100 | #97 | Exceptional 5.8% |
| Immigrants | Lebanon | 98.3 /100 | #98 | Exceptional 5.8% |
| Immigrants | Northern Europe | 98.2 /100 | #99 | Exceptional 5.8% |
| Immigrants | Serbia | 97.9 /100 | #100 | Exceptional 5.8% |
| Immigrants | South America | 97.9 /100 | #101 | Exceptional 5.8% |
| Immigrants | Kenya | 97.8 /100 | #102 | Exceptional 5.8% |
| Immigrants | Romania | 97.7 /100 | #103 | Exceptional 5.8% |
Demographics Similar to Immigrants from Oceania by Ambulatory Disability
In terms of ambulatory disability, the demographic groups most similar to Immigrants from Oceania are Ecuadorian (6.1%, a difference of 0.010%), Iraqi (6.1%, a difference of 0.12%), Nicaraguan (6.1%, a difference of 0.14%), Immigrants from Southern Europe (6.1%, a difference of 0.15%), and Basque (6.1%, a difference of 0.17%).
| Demographics | Rating | Rank | Ambulatory Disability |
| Central Americans | 69.8 /100 | #160 | Good 6.0% |
| Immigrants | Belarus | 69.2 /100 | #161 | Good 6.1% |
| Nigerians | 67.1 /100 | #162 | Good 6.1% |
| Lebanese | 66.2 /100 | #163 | Good 6.1% |
| Basques | 63.7 /100 | #164 | Good 6.1% |
| Nicaraguans | 63.2 /100 | #165 | Good 6.1% |
| Iraqis | 62.8 /100 | #166 | Good 6.1% |
| Immigrants | Oceania | 60.7 /100 | #167 | Good 6.1% |
| Ecuadorians | 60.5 /100 | #168 | Good 6.1% |
| Immigrants | Southern Europe | 58.1 /100 | #169 | Average 6.1% |
| Immigrants | Ecuador | 53.8 /100 | #170 | Average 6.1% |
| Moroccans | 52.6 /100 | #171 | Average 6.1% |
| Immigrants | Burma/Myanmar | 52.2 /100 | #172 | Average 6.1% |
| Croatians | 51.2 /100 | #173 | Average 6.1% |
| Immigrants | Canada | 50.0 /100 | #174 | Average 6.1% |