Salvadoran vs Immigrants from Bahamas Ambulatory Disability
COMPARE
Salvadoran
Immigrants from Bahamas
Ambulatory Disability
Ambulatory Disability Comparison
Salvadorans
Immigrants from Bahamas
5.8%
AMBULATORY DISABILITY
98.4/ 100
METRIC RATING
96th/ 347
METRIC RANK
6.5%
AMBULATORY DISABILITY
0.8/ 100
METRIC RATING
252nd/ 347
METRIC RANK
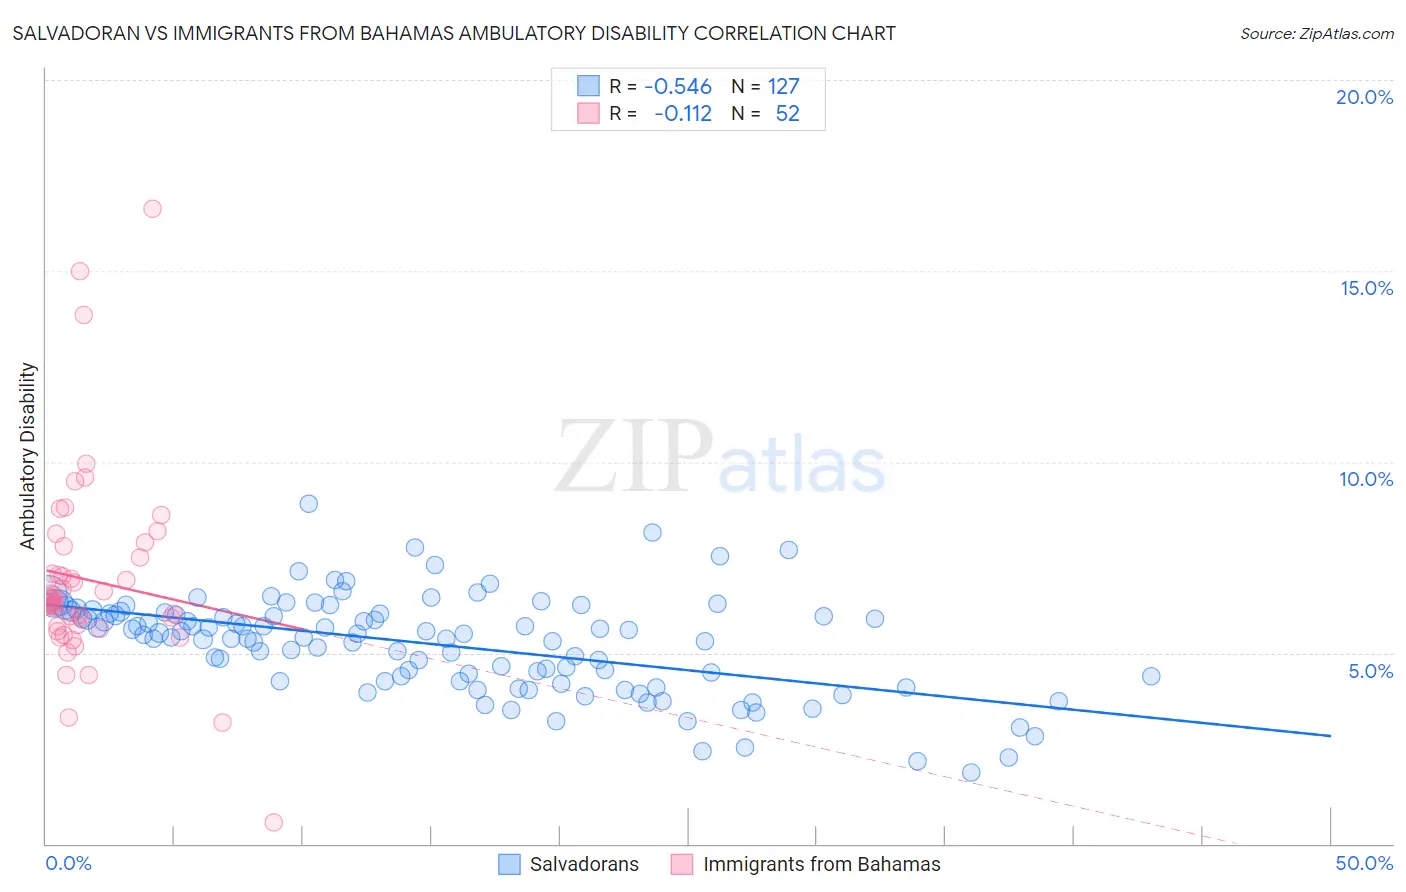
Salvadoran vs Immigrants from Bahamas Ambulatory Disability Correlation Chart
The statistical analysis conducted on geographies consisting of 398,824,360 people shows a substantial negative correlation between the proportion of Salvadorans and percentage of population with ambulatory disability in the United States with a correlation coefficient (R) of -0.546 and weighted average of 5.8%. Similarly, the statistical analysis conducted on geographies consisting of 104,629,900 people shows a poor negative correlation between the proportion of Immigrants from Bahamas and percentage of population with ambulatory disability in the United States with a correlation coefficient (R) of -0.112 and weighted average of 6.5%, a difference of 12.6%.
Ambulatory Disability Correlation Summary
| Measurement | Salvadoran | Immigrants from Bahamas |
| Minimum | 1.9% | 0.55% |
| Maximum | 8.9% | 16.6% |
| Range | 7.0% | 16.1% |
| Mean | 5.2% | 6.9% |
| Median | 5.5% | 6.3% |
| Interquartile 25% (IQ1) | 4.3% | 5.7% |
| Interquartile 75% (IQ3) | 6.0% | 7.7% |
| Interquartile Range (IQR) | 1.8% | 2.0% |
| Standard Deviation (Sample) | 1.3% | 2.6% |
| Standard Deviation (Population) | 1.3% | 2.6% |
Similar Demographics by Ambulatory Disability
Demographics Similar to Salvadorans by Ambulatory Disability
In terms of ambulatory disability, the demographic groups most similar to Salvadorans are Immigrants from El Salvador (5.8%, a difference of 0.020%), Immigrants from Somalia (5.8%, a difference of 0.040%), Kenyan (5.8%, a difference of 0.060%), Immigrants from Lebanon (5.8%, a difference of 0.070%), and Immigrants from Northern Europe (5.8%, a difference of 0.15%).
| Demographics | Rating | Rank | Ambulatory Disability |
| Bhutanese | 98.8 /100 | #89 | Exceptional 5.8% |
| Australians | 98.8 /100 | #90 | Exceptional 5.8% |
| Immigrants | Sudan | 98.8 /100 | #91 | Exceptional 5.8% |
| Immigrants | Sierra Leone | 98.6 /100 | #92 | Exceptional 5.8% |
| Immigrants | Denmark | 98.6 /100 | #93 | Exceptional 5.8% |
| Kenyans | 98.4 /100 | #94 | Exceptional 5.8% |
| Immigrants | El Salvador | 98.4 /100 | #95 | Exceptional 5.8% |
| Salvadorans | 98.4 /100 | #96 | Exceptional 5.8% |
| Immigrants | Somalia | 98.3 /100 | #97 | Exceptional 5.8% |
| Immigrants | Lebanon | 98.3 /100 | #98 | Exceptional 5.8% |
| Immigrants | Northern Europe | 98.2 /100 | #99 | Exceptional 5.8% |
| Immigrants | Serbia | 97.9 /100 | #100 | Exceptional 5.8% |
| Immigrants | South America | 97.9 /100 | #101 | Exceptional 5.8% |
| Immigrants | Kenya | 97.8 /100 | #102 | Exceptional 5.8% |
| Immigrants | Romania | 97.7 /100 | #103 | Exceptional 5.8% |
Demographics Similar to Immigrants from Bahamas by Ambulatory Disability
In terms of ambulatory disability, the demographic groups most similar to Immigrants from Bahamas are Scottish (6.5%, a difference of 0.050%), Hawaiian (6.5%, a difference of 0.20%), Belizean (6.5%, a difference of 0.21%), Welsh (6.5%, a difference of 0.28%), and Immigrants from Uzbekistan (6.5%, a difference of 0.36%).
| Demographics | Rating | Rank | Ambulatory Disability |
| Tlingit-Haida | 1.5 /100 | #245 | Tragic 6.5% |
| Armenians | 1.5 /100 | #246 | Tragic 6.5% |
| Immigrants | Cuba | 1.4 /100 | #247 | Tragic 6.5% |
| Immigrants | Portugal | 1.4 /100 | #248 | Tragic 6.5% |
| Native Hawaiians | 1.1 /100 | #249 | Tragic 6.5% |
| Chinese | 1.0 /100 | #250 | Tragic 6.5% |
| Hawaiians | 0.9 /100 | #251 | Tragic 6.5% |
| Immigrants | Bahamas | 0.8 /100 | #252 | Tragic 6.5% |
| Scottish | 0.7 /100 | #253 | Tragic 6.5% |
| Belizeans | 0.7 /100 | #254 | Tragic 6.5% |
| Welsh | 0.6 /100 | #255 | Tragic 6.5% |
| Immigrants | Uzbekistan | 0.6 /100 | #256 | Tragic 6.5% |
| Bermudans | 0.5 /100 | #257 | Tragic 6.5% |
| Spanish American Indians | 0.5 /100 | #258 | Tragic 6.5% |
| Aleuts | 0.4 /100 | #259 | Tragic 6.6% |