Salvadoran vs Immigrants from Oceania In Labor Force | Age 35-44
COMPARE
Salvadoran
Immigrants from Oceania
In Labor Force | Age 35-44
In Labor Force | Age 35-44 Comparison
Salvadorans
Immigrants from Oceania
83.6%
IN LABOR FORCE | AGE 35-44
0.4/ 100
METRIC RATING
251st/ 347
METRIC RANK
83.9%
IN LABOR FORCE | AGE 35-44
2.6/ 100
METRIC RATING
234th/ 347
METRIC RANK
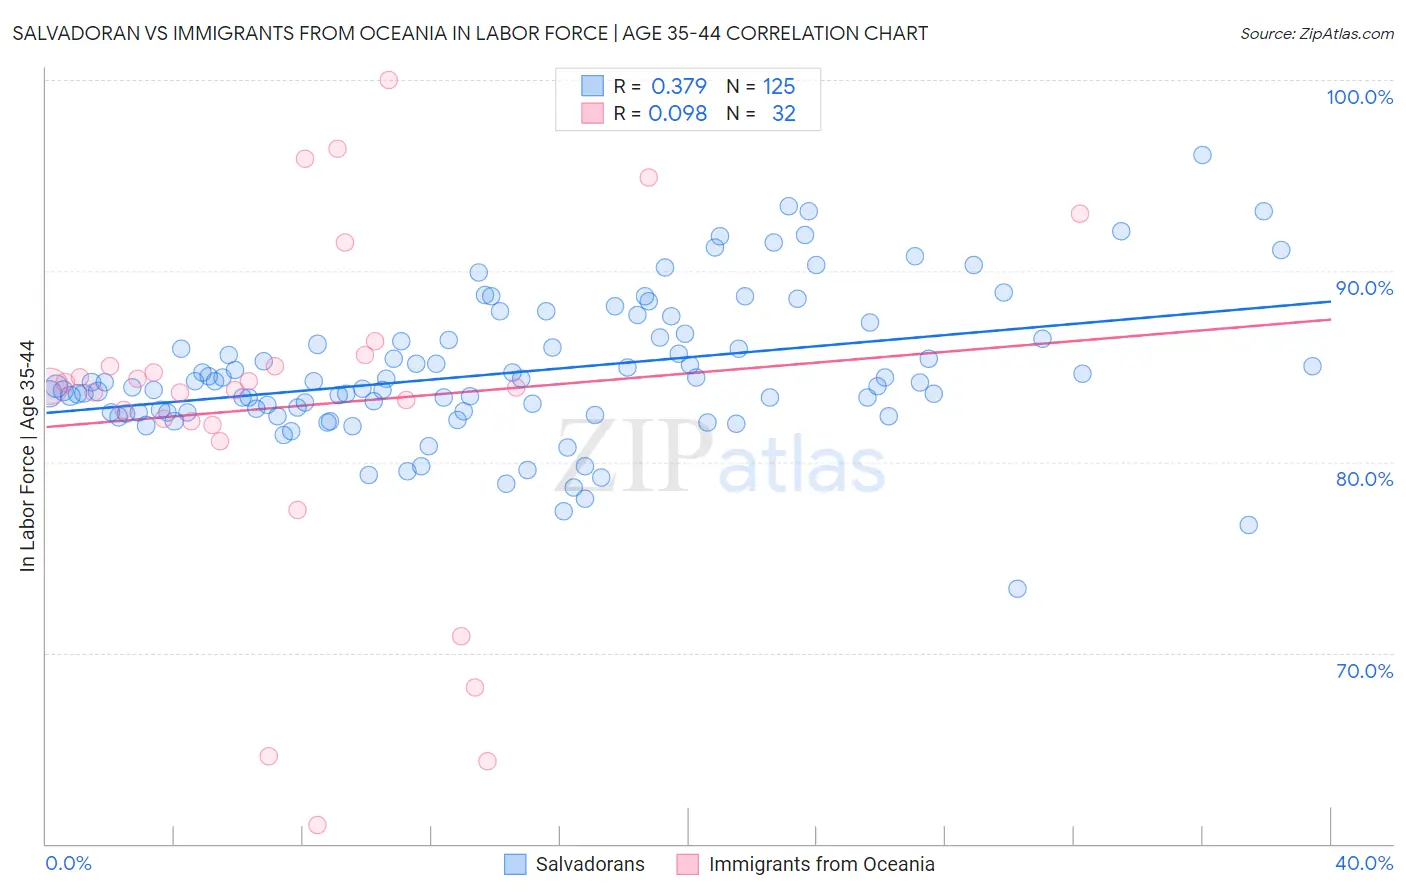
Salvadoran vs Immigrants from Oceania In Labor Force | Age 35-44 Correlation Chart
The statistical analysis conducted on geographies consisting of 398,774,935 people shows a mild positive correlation between the proportion of Salvadorans and labor force participation rate among population between the ages 35 and 44 in the United States with a correlation coefficient (R) of 0.379 and weighted average of 83.6%. Similarly, the statistical analysis conducted on geographies consisting of 305,435,378 people shows a slight positive correlation between the proportion of Immigrants from Oceania and labor force participation rate among population between the ages 35 and 44 in the United States with a correlation coefficient (R) of 0.098 and weighted average of 83.9%, a difference of 0.30%.
In Labor Force | Age 35-44 Correlation Summary
| Measurement | Salvadoran | Immigrants from Oceania |
| Minimum | 73.3% | 61.0% |
| Maximum | 96.1% | 100.0% |
| Range | 22.8% | 39.0% |
| Mean | 84.7% | 82.9% |
| Median | 84.1% | 83.9% |
| Interquartile 25% (IQ1) | 82.6% | 82.0% |
| Interquartile 75% (IQ3) | 86.4% | 85.3% |
| Interquartile Range (IQR) | 3.9% | 3.3% |
| Standard Deviation (Sample) | 3.7% | 9.1% |
| Standard Deviation (Population) | 3.7% | 9.0% |
Demographics Similar to Salvadorans and Immigrants from Oceania by In Labor Force | Age 35-44
In terms of in labor force | age 35-44, the demographic groups most similar to Salvadorans are Immigrants from Guyana (83.6%, a difference of 0.0%), White/Caucasian (83.6%, a difference of 0.020%), Immigrants from St. Vincent and the Grenadines (83.7%, a difference of 0.070%), Indonesian (83.7%, a difference of 0.10%), and Immigrants from Armenia (83.7%, a difference of 0.12%). Similarly, the demographic groups most similar to Immigrants from Oceania are Immigrants from Germany (83.9%, a difference of 0.010%), Immigrants from Syria (83.9%, a difference of 0.010%), Native Hawaiian (83.9%, a difference of 0.020%), West Indian (83.9%, a difference of 0.020%), and English (83.8%, a difference of 0.060%).
| Demographics | Rating | Rank | In Labor Force | Age 35-44 |
| Native Hawaiians | 3.0 /100 | #232 | Tragic 83.9% |
| Immigrants | Germany | 2.8 /100 | #233 | Tragic 83.9% |
| Immigrants | Oceania | 2.6 /100 | #234 | Tragic 83.9% |
| Immigrants | Syria | 2.5 /100 | #235 | Tragic 83.9% |
| West Indians | 2.4 /100 | #236 | Tragic 83.9% |
| English | 1.8 /100 | #237 | Tragic 83.8% |
| Immigrants | Laos | 1.7 /100 | #238 | Tragic 83.8% |
| Celtics | 1.4 /100 | #239 | Tragic 83.8% |
| Arabs | 1.3 /100 | #240 | Tragic 83.8% |
| Iraqis | 1.3 /100 | #241 | Tragic 83.8% |
| Immigrants | Cambodia | 1.1 /100 | #242 | Tragic 83.8% |
| Immigrants | Western Asia | 1.1 /100 | #243 | Tragic 83.8% |
| Guyanese | 1.1 /100 | #244 | Tragic 83.8% |
| Malaysians | 1.1 /100 | #245 | Tragic 83.8% |
| Immigrants | Immigrants | 1.0 /100 | #246 | Tragic 83.7% |
| Immigrants | Armenia | 0.9 /100 | #247 | Tragic 83.7% |
| Indonesians | 0.8 /100 | #248 | Tragic 83.7% |
| Immigrants | St. Vincent and the Grenadines | 0.7 /100 | #249 | Tragic 83.7% |
| Whites/Caucasians | 0.5 /100 | #250 | Tragic 83.6% |
| Salvadorans | 0.4 /100 | #251 | Tragic 83.6% |
| Immigrants | Guyana | 0.4 /100 | #252 | Tragic 83.6% |