Salvadoran vs Immigrants from Cameroon Ambulatory Disability
COMPARE
Salvadoran
Immigrants from Cameroon
Ambulatory Disability
Ambulatory Disability Comparison
Salvadorans
Immigrants from Cameroon
5.8%
AMBULATORY DISABILITY
98.4/ 100
METRIC RATING
96th/ 347
METRIC RANK
5.7%
AMBULATORY DISABILITY
99.4/ 100
METRIC RATING
74th/ 347
METRIC RANK
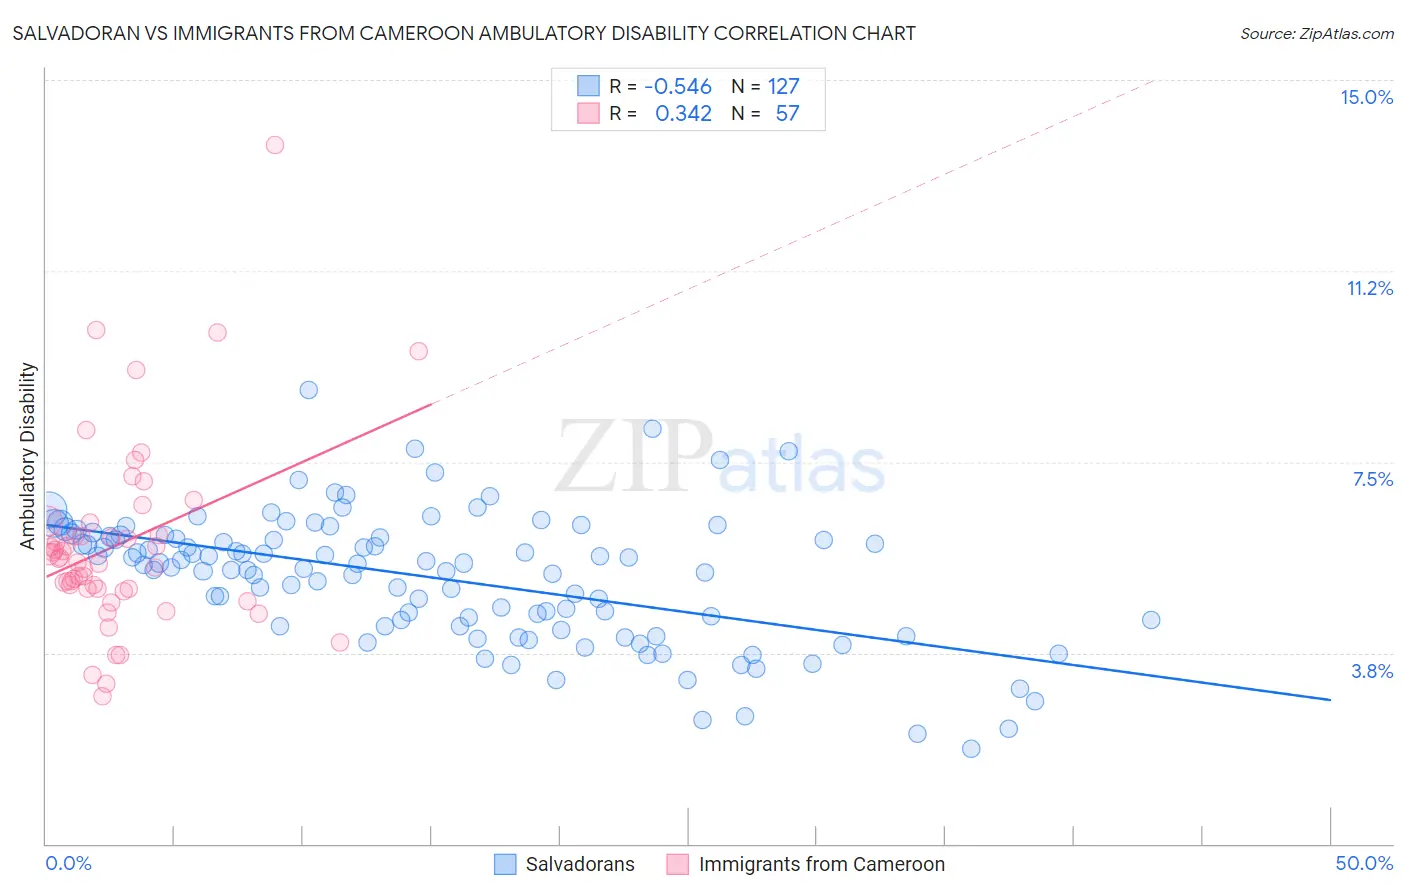
Salvadoran vs Immigrants from Cameroon Ambulatory Disability Correlation Chart
The statistical analysis conducted on geographies consisting of 398,824,360 people shows a substantial negative correlation between the proportion of Salvadorans and percentage of population with ambulatory disability in the United States with a correlation coefficient (R) of -0.546 and weighted average of 5.8%. Similarly, the statistical analysis conducted on geographies consisting of 130,739,199 people shows a mild positive correlation between the proportion of Immigrants from Cameroon and percentage of population with ambulatory disability in the United States with a correlation coefficient (R) of 0.342 and weighted average of 5.7%, a difference of 1.4%.
Ambulatory Disability Correlation Summary
| Measurement | Salvadoran | Immigrants from Cameroon |
| Minimum | 1.9% | 2.9% |
| Maximum | 8.9% | 13.7% |
| Range | 7.0% | 10.8% |
| Mean | 5.2% | 5.9% |
| Median | 5.5% | 5.6% |
| Interquartile 25% (IQ1) | 4.3% | 5.0% |
| Interquartile 75% (IQ3) | 6.0% | 6.2% |
| Interquartile Range (IQR) | 1.8% | 1.2% |
| Standard Deviation (Sample) | 1.3% | 1.9% |
| Standard Deviation (Population) | 1.3% | 1.8% |
Similar Demographics by Ambulatory Disability
Demographics Similar to Salvadorans by Ambulatory Disability
In terms of ambulatory disability, the demographic groups most similar to Salvadorans are Immigrants from El Salvador (5.8%, a difference of 0.020%), Immigrants from Somalia (5.8%, a difference of 0.040%), Kenyan (5.8%, a difference of 0.060%), Immigrants from Lebanon (5.8%, a difference of 0.070%), and Immigrants from Northern Europe (5.8%, a difference of 0.15%).
| Demographics | Rating | Rank | Ambulatory Disability |
| Bhutanese | 98.8 /100 | #89 | Exceptional 5.8% |
| Australians | 98.8 /100 | #90 | Exceptional 5.8% |
| Immigrants | Sudan | 98.8 /100 | #91 | Exceptional 5.8% |
| Immigrants | Sierra Leone | 98.6 /100 | #92 | Exceptional 5.8% |
| Immigrants | Denmark | 98.6 /100 | #93 | Exceptional 5.8% |
| Kenyans | 98.4 /100 | #94 | Exceptional 5.8% |
| Immigrants | El Salvador | 98.4 /100 | #95 | Exceptional 5.8% |
| Salvadorans | 98.4 /100 | #96 | Exceptional 5.8% |
| Immigrants | Somalia | 98.3 /100 | #97 | Exceptional 5.8% |
| Immigrants | Lebanon | 98.3 /100 | #98 | Exceptional 5.8% |
| Immigrants | Northern Europe | 98.2 /100 | #99 | Exceptional 5.8% |
| Immigrants | Serbia | 97.9 /100 | #100 | Exceptional 5.8% |
| Immigrants | South America | 97.9 /100 | #101 | Exceptional 5.8% |
| Immigrants | Kenya | 97.8 /100 | #102 | Exceptional 5.8% |
| Immigrants | Romania | 97.7 /100 | #103 | Exceptional 5.8% |
Demographics Similar to Immigrants from Cameroon by Ambulatory Disability
In terms of ambulatory disability, the demographic groups most similar to Immigrants from Cameroon are Immigrants from Northern Africa (5.7%, a difference of 0.010%), Brazilian (5.7%, a difference of 0.020%), Immigrants from Peru (5.7%, a difference of 0.040%), Immigrants from South Africa (5.7%, a difference of 0.050%), and Sudanese (5.7%, a difference of 0.070%).
| Demographics | Rating | Rank | Ambulatory Disability |
| Immigrants | Uganda | 99.6 /100 | #67 | Exceptional 5.7% |
| Sri Lankans | 99.6 /100 | #68 | Exceptional 5.7% |
| Peruvians | 99.5 /100 | #69 | Exceptional 5.7% |
| Sierra Leoneans | 99.4 /100 | #70 | Exceptional 5.7% |
| Immigrants | Peru | 99.4 /100 | #71 | Exceptional 5.7% |
| Brazilians | 99.4 /100 | #72 | Exceptional 5.7% |
| Immigrants | Northern Africa | 99.4 /100 | #73 | Exceptional 5.7% |
| Immigrants | Cameroon | 99.4 /100 | #74 | Exceptional 5.7% |
| Immigrants | South Africa | 99.3 /100 | #75 | Exceptional 5.7% |
| Sudanese | 99.3 /100 | #76 | Exceptional 5.7% |
| Immigrants | Vietnam | 99.3 /100 | #77 | Exceptional 5.7% |
| Somalis | 99.2 /100 | #78 | Exceptional 5.7% |
| Chileans | 99.2 /100 | #79 | Exceptional 5.7% |
| Immigrants | Ireland | 99.2 /100 | #80 | Exceptional 5.7% |
| Immigrants | Jordan | 99.2 /100 | #81 | Exceptional 5.7% |