Salvadoran vs Immigrants from Norway Ambulatory Disability
COMPARE
Salvadoran
Immigrants from Norway
Ambulatory Disability
Ambulatory Disability Comparison
Salvadorans
Immigrants from Norway
5.8%
AMBULATORY DISABILITY
98.4/ 100
METRIC RATING
96th/ 347
METRIC RANK
5.9%
AMBULATORY DISABILITY
90.5/ 100
METRIC RATING
129th/ 347
METRIC RANK
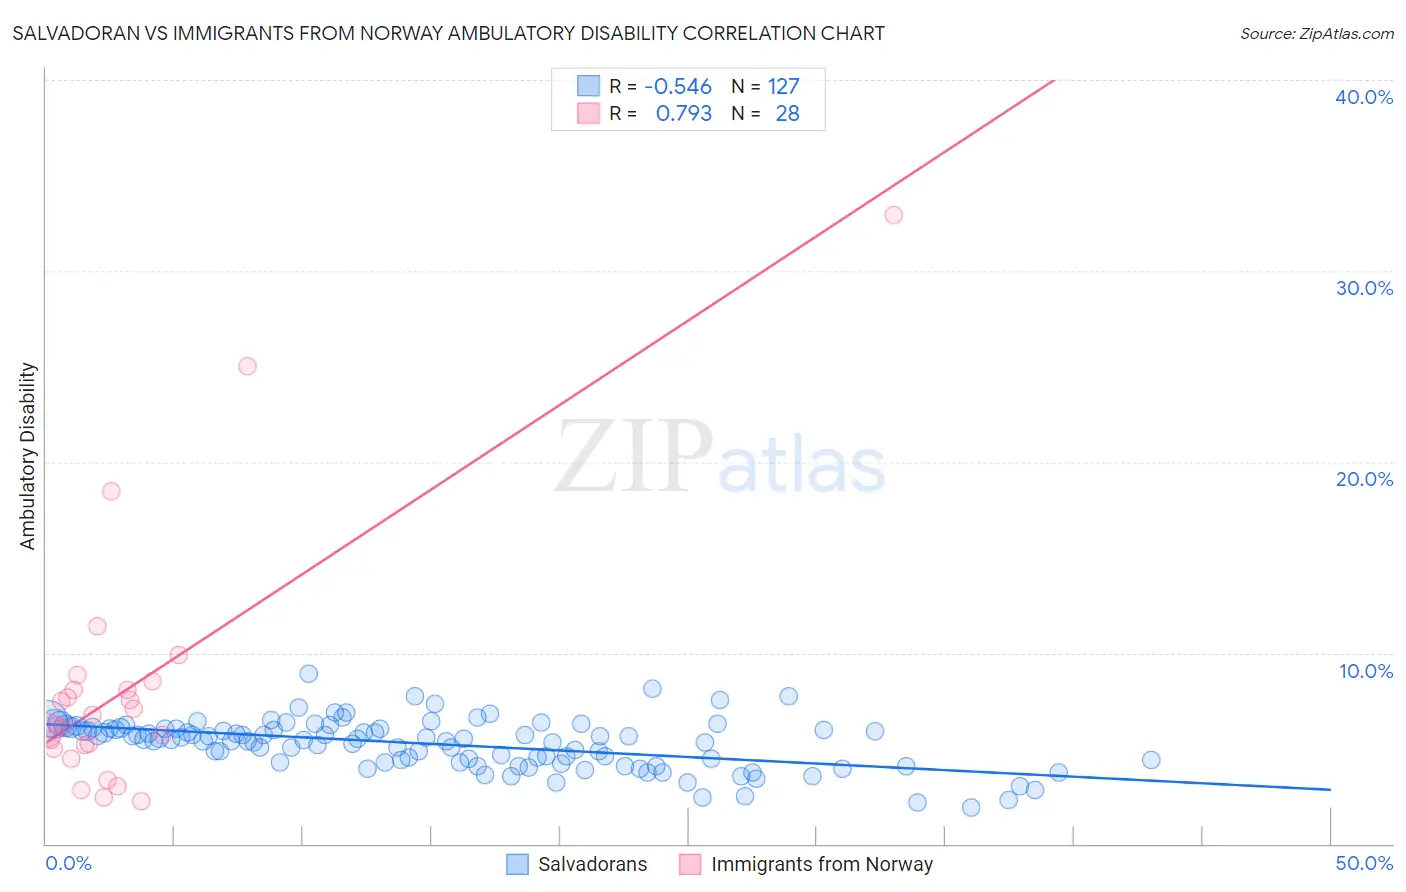
Salvadoran vs Immigrants from Norway Ambulatory Disability Correlation Chart
The statistical analysis conducted on geographies consisting of 398,824,360 people shows a substantial negative correlation between the proportion of Salvadorans and percentage of population with ambulatory disability in the United States with a correlation coefficient (R) of -0.546 and weighted average of 5.8%. Similarly, the statistical analysis conducted on geographies consisting of 116,699,496 people shows a strong positive correlation between the proportion of Immigrants from Norway and percentage of population with ambulatory disability in the United States with a correlation coefficient (R) of 0.793 and weighted average of 5.9%, a difference of 2.6%.
Ambulatory Disability Correlation Summary
| Measurement | Salvadoran | Immigrants from Norway |
| Minimum | 1.9% | 2.3% |
| Maximum | 8.9% | 33.0% |
| Range | 7.0% | 30.7% |
| Mean | 5.2% | 8.2% |
| Median | 5.5% | 6.5% |
| Interquartile 25% (IQ1) | 4.3% | 5.1% |
| Interquartile 75% (IQ3) | 6.0% | 8.3% |
| Interquartile Range (IQR) | 1.8% | 3.2% |
| Standard Deviation (Sample) | 1.3% | 6.8% |
| Standard Deviation (Population) | 1.3% | 6.6% |
Similar Demographics by Ambulatory Disability
Demographics Similar to Salvadorans by Ambulatory Disability
In terms of ambulatory disability, the demographic groups most similar to Salvadorans are Immigrants from El Salvador (5.8%, a difference of 0.020%), Immigrants from Somalia (5.8%, a difference of 0.040%), Kenyan (5.8%, a difference of 0.060%), Immigrants from Lebanon (5.8%, a difference of 0.070%), and Immigrants from Northern Europe (5.8%, a difference of 0.15%).
| Demographics | Rating | Rank | Ambulatory Disability |
| Bhutanese | 98.8 /100 | #89 | Exceptional 5.8% |
| Australians | 98.8 /100 | #90 | Exceptional 5.8% |
| Immigrants | Sudan | 98.8 /100 | #91 | Exceptional 5.8% |
| Immigrants | Sierra Leone | 98.6 /100 | #92 | Exceptional 5.8% |
| Immigrants | Denmark | 98.6 /100 | #93 | Exceptional 5.8% |
| Kenyans | 98.4 /100 | #94 | Exceptional 5.8% |
| Immigrants | El Salvador | 98.4 /100 | #95 | Exceptional 5.8% |
| Salvadorans | 98.4 /100 | #96 | Exceptional 5.8% |
| Immigrants | Somalia | 98.3 /100 | #97 | Exceptional 5.8% |
| Immigrants | Lebanon | 98.3 /100 | #98 | Exceptional 5.8% |
| Immigrants | Northern Europe | 98.2 /100 | #99 | Exceptional 5.8% |
| Immigrants | Serbia | 97.9 /100 | #100 | Exceptional 5.8% |
| Immigrants | South America | 97.9 /100 | #101 | Exceptional 5.8% |
| Immigrants | Kenya | 97.8 /100 | #102 | Exceptional 5.8% |
| Immigrants | Romania | 97.7 /100 | #103 | Exceptional 5.8% |
Demographics Similar to Immigrants from Norway by Ambulatory Disability
In terms of ambulatory disability, the demographic groups most similar to Immigrants from Norway are Immigrants from Western Asia (5.9%, a difference of 0.030%), Immigrants from Nigeria (5.9%, a difference of 0.070%), Immigrants from Kazakhstan (5.9%, a difference of 0.11%), Immigrants from Costa Rica (5.9%, a difference of 0.14%), and Arab (5.9%, a difference of 0.17%).
| Demographics | Rating | Rank | Ambulatory Disability |
| Icelanders | 92.6 /100 | #122 | Exceptional 5.9% |
| Immigrants | Russia | 92.4 /100 | #123 | Exceptional 5.9% |
| Immigrants | Middle Africa | 92.2 /100 | #124 | Exceptional 5.9% |
| Koreans | 91.6 /100 | #125 | Exceptional 5.9% |
| Arabs | 91.5 /100 | #126 | Exceptional 5.9% |
| Immigrants | Nigeria | 90.9 /100 | #127 | Exceptional 5.9% |
| Immigrants | Western Asia | 90.7 /100 | #128 | Exceptional 5.9% |
| Immigrants | Norway | 90.5 /100 | #129 | Exceptional 5.9% |
| Immigrants | Kazakhstan | 89.7 /100 | #130 | Excellent 5.9% |
| Immigrants | Costa Rica | 89.5 /100 | #131 | Excellent 5.9% |
| Immigrants | Europe | 87.8 /100 | #132 | Excellent 6.0% |
| Immigrants | Immigrants | 86.9 /100 | #133 | Excellent 6.0% |
| Ute | 86.6 /100 | #134 | Excellent 6.0% |
| Immigrants | Italy | 85.0 /100 | #135 | Excellent 6.0% |
| Immigrants | North Macedonia | 84.1 /100 | #136 | Excellent 6.0% |