Salvadoran vs Immigrants from Germany Ambulatory Disability
COMPARE
Salvadoran
Immigrants from Germany
Ambulatory Disability
Ambulatory Disability Comparison
Salvadorans
Immigrants from Germany
5.8%
AMBULATORY DISABILITY
98.4/ 100
METRIC RATING
96th/ 347
METRIC RANK
6.4%
AMBULATORY DISABILITY
1.8/ 100
METRIC RATING
237th/ 347
METRIC RANK
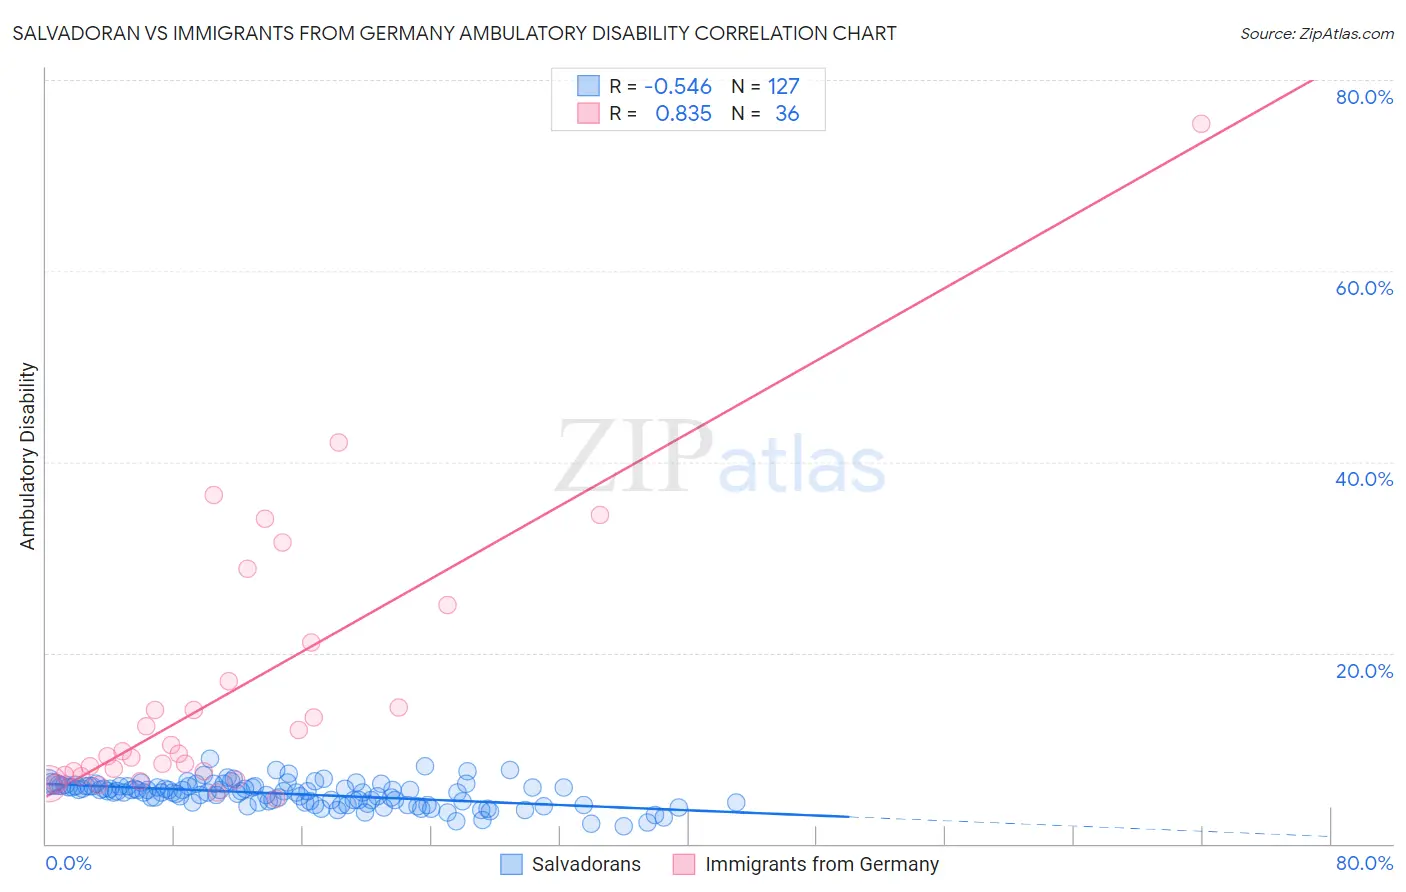
Salvadoran vs Immigrants from Germany Ambulatory Disability Correlation Chart
The statistical analysis conducted on geographies consisting of 398,824,360 people shows a substantial negative correlation between the proportion of Salvadorans and percentage of population with ambulatory disability in the United States with a correlation coefficient (R) of -0.546 and weighted average of 5.8%. Similarly, the statistical analysis conducted on geographies consisting of 463,770,128 people shows a very strong positive correlation between the proportion of Immigrants from Germany and percentage of population with ambulatory disability in the United States with a correlation coefficient (R) of 0.835 and weighted average of 6.4%, a difference of 11.3%.
Ambulatory Disability Correlation Summary
| Measurement | Salvadoran | Immigrants from Germany |
| Minimum | 1.9% | 4.7% |
| Maximum | 8.9% | 75.4% |
| Range | 7.0% | 70.7% |
| Mean | 5.2% | 16.1% |
| Median | 5.5% | 9.6% |
| Interquartile 25% (IQ1) | 4.3% | 7.4% |
| Interquartile 75% (IQ3) | 6.0% | 19.0% |
| Interquartile Range (IQR) | 1.8% | 11.6% |
| Standard Deviation (Sample) | 1.3% | 14.5% |
| Standard Deviation (Population) | 1.3% | 14.3% |
Similar Demographics by Ambulatory Disability
Demographics Similar to Salvadorans by Ambulatory Disability
In terms of ambulatory disability, the demographic groups most similar to Salvadorans are Immigrants from El Salvador (5.8%, a difference of 0.020%), Immigrants from Somalia (5.8%, a difference of 0.040%), Kenyan (5.8%, a difference of 0.060%), Immigrants from Lebanon (5.8%, a difference of 0.070%), and Immigrants from Northern Europe (5.8%, a difference of 0.15%).
| Demographics | Rating | Rank | Ambulatory Disability |
| Bhutanese | 98.8 /100 | #89 | Exceptional 5.8% |
| Australians | 98.8 /100 | #90 | Exceptional 5.8% |
| Immigrants | Sudan | 98.8 /100 | #91 | Exceptional 5.8% |
| Immigrants | Sierra Leone | 98.6 /100 | #92 | Exceptional 5.8% |
| Immigrants | Denmark | 98.6 /100 | #93 | Exceptional 5.8% |
| Kenyans | 98.4 /100 | #94 | Exceptional 5.8% |
| Immigrants | El Salvador | 98.4 /100 | #95 | Exceptional 5.8% |
| Salvadorans | 98.4 /100 | #96 | Exceptional 5.8% |
| Immigrants | Somalia | 98.3 /100 | #97 | Exceptional 5.8% |
| Immigrants | Lebanon | 98.3 /100 | #98 | Exceptional 5.8% |
| Immigrants | Northern Europe | 98.2 /100 | #99 | Exceptional 5.8% |
| Immigrants | Serbia | 97.9 /100 | #100 | Exceptional 5.8% |
| Immigrants | South America | 97.9 /100 | #101 | Exceptional 5.8% |
| Immigrants | Kenya | 97.8 /100 | #102 | Exceptional 5.8% |
| Immigrants | Romania | 97.7 /100 | #103 | Exceptional 5.8% |
Demographics Similar to Immigrants from Germany by Ambulatory Disability
In terms of ambulatory disability, the demographic groups most similar to Immigrants from Germany are Haitian (6.4%, a difference of 0.010%), Senegalese (6.4%, a difference of 0.080%), Dutch (6.4%, a difference of 0.090%), Immigrants from Senegal (6.4%, a difference of 0.10%), and Immigrants from Haiti (6.5%, a difference of 0.19%).
| Demographics | Rating | Rank | Ambulatory Disability |
| Mexicans | 3.5 /100 | #230 | Tragic 6.4% |
| Panamanians | 3.1 /100 | #231 | Tragic 6.4% |
| Assyrians/Chaldeans/Syriacs | 2.4 /100 | #232 | Tragic 6.4% |
| Sub-Saharan Africans | 2.3 /100 | #233 | Tragic 6.4% |
| Immigrants | Liberia | 2.3 /100 | #234 | Tragic 6.4% |
| Hispanics or Latinos | 2.2 /100 | #235 | Tragic 6.4% |
| Dutch | 2.0 /100 | #236 | Tragic 6.4% |
| Immigrants | Germany | 1.8 /100 | #237 | Tragic 6.4% |
| Haitians | 1.8 /100 | #238 | Tragic 6.4% |
| Senegalese | 1.7 /100 | #239 | Tragic 6.4% |
| Immigrants | Senegal | 1.7 /100 | #240 | Tragic 6.4% |
| Immigrants | Haiti | 1.6 /100 | #241 | Tragic 6.5% |
| Spaniards | 1.6 /100 | #242 | Tragic 6.5% |
| Germans | 1.5 /100 | #243 | Tragic 6.5% |
| Immigrants | Panama | 1.5 /100 | #244 | Tragic 6.5% |