Salvadoran vs Immigrants from Oceania Median Male Earnings
COMPARE
Salvadoran
Immigrants from Oceania
Median Male Earnings
Median Male Earnings Comparison
Salvadorans
Immigrants from Oceania
$48,646
MEDIAN MALE EARNINGS
0.3/ 100
METRIC RATING
272nd/ 347
METRIC RANK
$55,712
MEDIAN MALE EARNINGS
76.8/ 100
METRIC RATING
151st/ 347
METRIC RANK
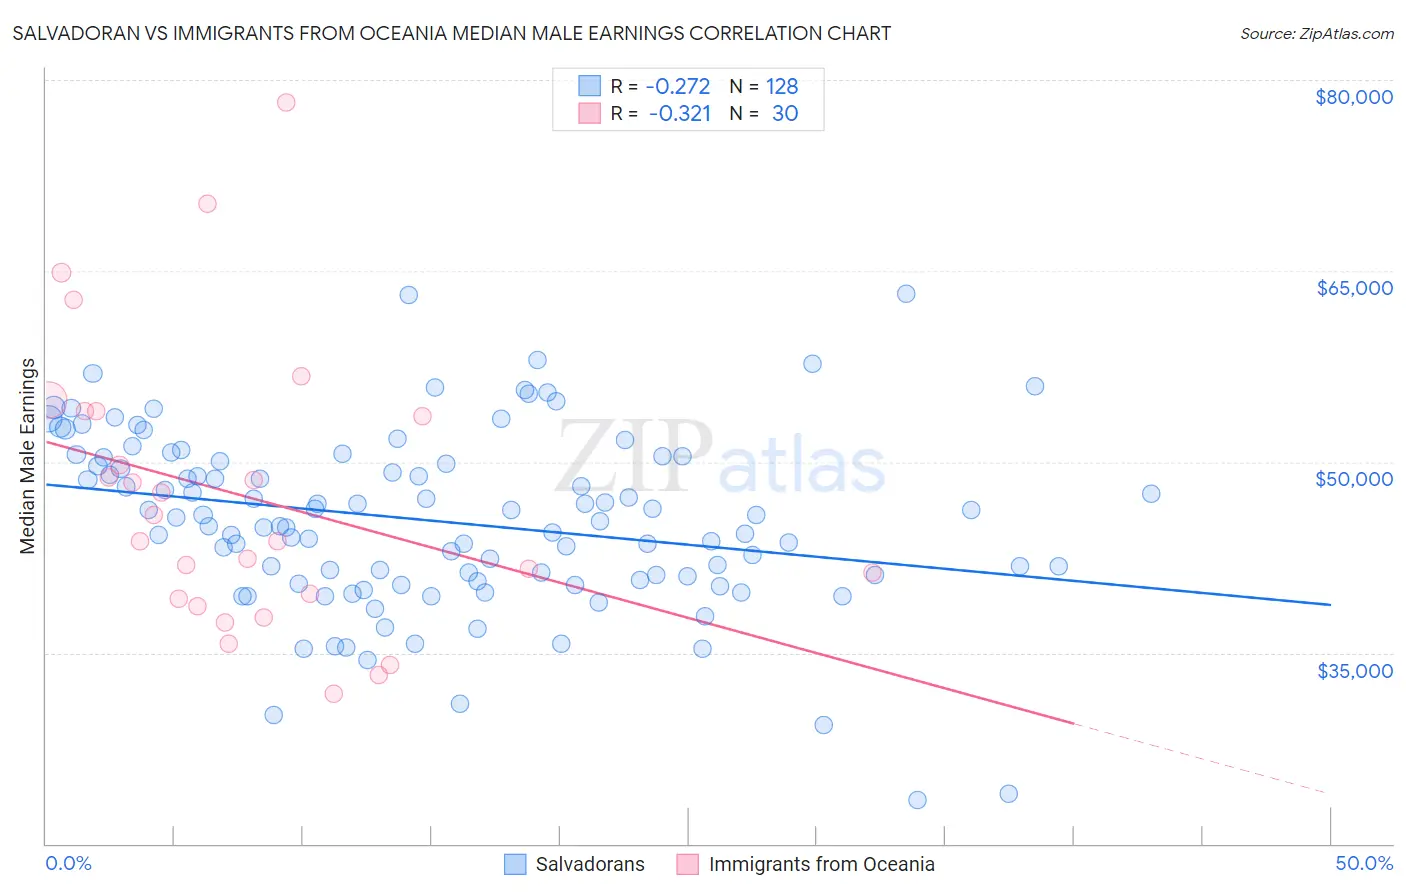
Salvadoran vs Immigrants from Oceania Median Male Earnings Correlation Chart
The statistical analysis conducted on geographies consisting of 398,918,079 people shows a weak negative correlation between the proportion of Salvadorans and median male earnings in the United States with a correlation coefficient (R) of -0.272 and weighted average of $48,646. Similarly, the statistical analysis conducted on geographies consisting of 305,444,648 people shows a mild negative correlation between the proportion of Immigrants from Oceania and median male earnings in the United States with a correlation coefficient (R) of -0.321 and weighted average of $55,712, a difference of 14.5%.
Median Male Earnings Correlation Summary
| Measurement | Salvadoran | Immigrants from Oceania |
| Minimum | $23,439 | $31,736 |
| Maximum | $63,214 | $78,276 |
| Range | $39,775 | $46,540 |
| Mean | $45,362 | $47,354 |
| Median | $45,515 | $44,818 |
| Interquartile 25% (IQ1) | $40,883 | $39,222 |
| Interquartile 75% (IQ3) | $50,182 | $54,011 |
| Interquartile Range (IQR) | $9,299 | $14,789 |
| Standard Deviation (Sample) | $7,004 | $11,148 |
| Standard Deviation (Population) | $6,977 | $10,961 |
Similar Demographics by Median Male Earnings
Demographics Similar to Salvadorans by Median Male Earnings
In terms of median male earnings, the demographic groups most similar to Salvadorans are Jamaican ($48,632, a difference of 0.030%), Cherokee ($48,669, a difference of 0.050%), Potawatomi ($48,768, a difference of 0.25%), Colville ($48,516, a difference of 0.27%), and Tsimshian ($48,836, a difference of 0.39%).
| Demographics | Rating | Rank | Median Male Earnings |
| Immigrants | Laos | 0.6 /100 | #265 | Tragic $49,190 |
| Somalis | 0.5 /100 | #266 | Tragic $49,025 |
| Spanish Americans | 0.5 /100 | #267 | Tragic $49,008 |
| Ute | 0.4 /100 | #268 | Tragic $48,899 |
| Tsimshian | 0.4 /100 | #269 | Tragic $48,836 |
| Potawatomi | 0.4 /100 | #270 | Tragic $48,768 |
| Cherokee | 0.3 /100 | #271 | Tragic $48,669 |
| Salvadorans | 0.3 /100 | #272 | Tragic $48,646 |
| Jamaicans | 0.3 /100 | #273 | Tragic $48,632 |
| Colville | 0.3 /100 | #274 | Tragic $48,516 |
| Immigrants | Somalia | 0.3 /100 | #275 | Tragic $48,439 |
| Blackfeet | 0.3 /100 | #276 | Tragic $48,402 |
| Belizeans | 0.2 /100 | #277 | Tragic $48,358 |
| Immigrants | Liberia | 0.2 /100 | #278 | Tragic $48,317 |
| Hmong | 0.2 /100 | #279 | Tragic $48,254 |
Demographics Similar to Immigrants from Oceania by Median Male Earnings
In terms of median male earnings, the demographic groups most similar to Immigrants from Oceania are Swiss ($55,731, a difference of 0.030%), English ($55,747, a difference of 0.060%), Peruvian ($55,659, a difference of 0.10%), Scottish ($55,793, a difference of 0.15%), and Immigrants from Philippines ($55,809, a difference of 0.17%).
| Demographics | Rating | Rank | Median Male Earnings |
| Immigrants | Uganda | 82.4 /100 | #144 | Excellent $56,064 |
| Norwegians | 80.9 /100 | #145 | Excellent $55,965 |
| Immigrants | Chile | 80.7 /100 | #146 | Excellent $55,954 |
| Immigrants | Philippines | 78.4 /100 | #147 | Good $55,809 |
| Scottish | 78.2 /100 | #148 | Good $55,793 |
| English | 77.4 /100 | #149 | Good $55,747 |
| Swiss | 77.1 /100 | #150 | Good $55,731 |
| Immigrants | Oceania | 76.8 /100 | #151 | Good $55,712 |
| Peruvians | 75.8 /100 | #152 | Good $55,659 |
| Immigrants | Nepal | 75.0 /100 | #153 | Good $55,615 |
| Taiwanese | 73.9 /100 | #154 | Good $55,556 |
| Scandinavians | 73.4 /100 | #155 | Good $55,527 |
| Immigrants | Ethiopia | 71.6 /100 | #156 | Good $55,434 |
| Icelanders | 71.2 /100 | #157 | Good $55,415 |
| Czechoslovakians | 70.5 /100 | #158 | Good $55,382 |