Immigrants from Ghana vs Immigrants from Oceania Ambulatory Disability
COMPARE
Immigrants from Ghana
Immigrants from Oceania
Ambulatory Disability
Ambulatory Disability Comparison
Immigrants from Ghana
Immigrants from Oceania
6.1%
AMBULATORY DISABILITY
41.2/ 100
METRIC RATING
184th/ 347
METRIC RANK
6.1%
AMBULATORY DISABILITY
60.7/ 100
METRIC RATING
167th/ 347
METRIC RANK
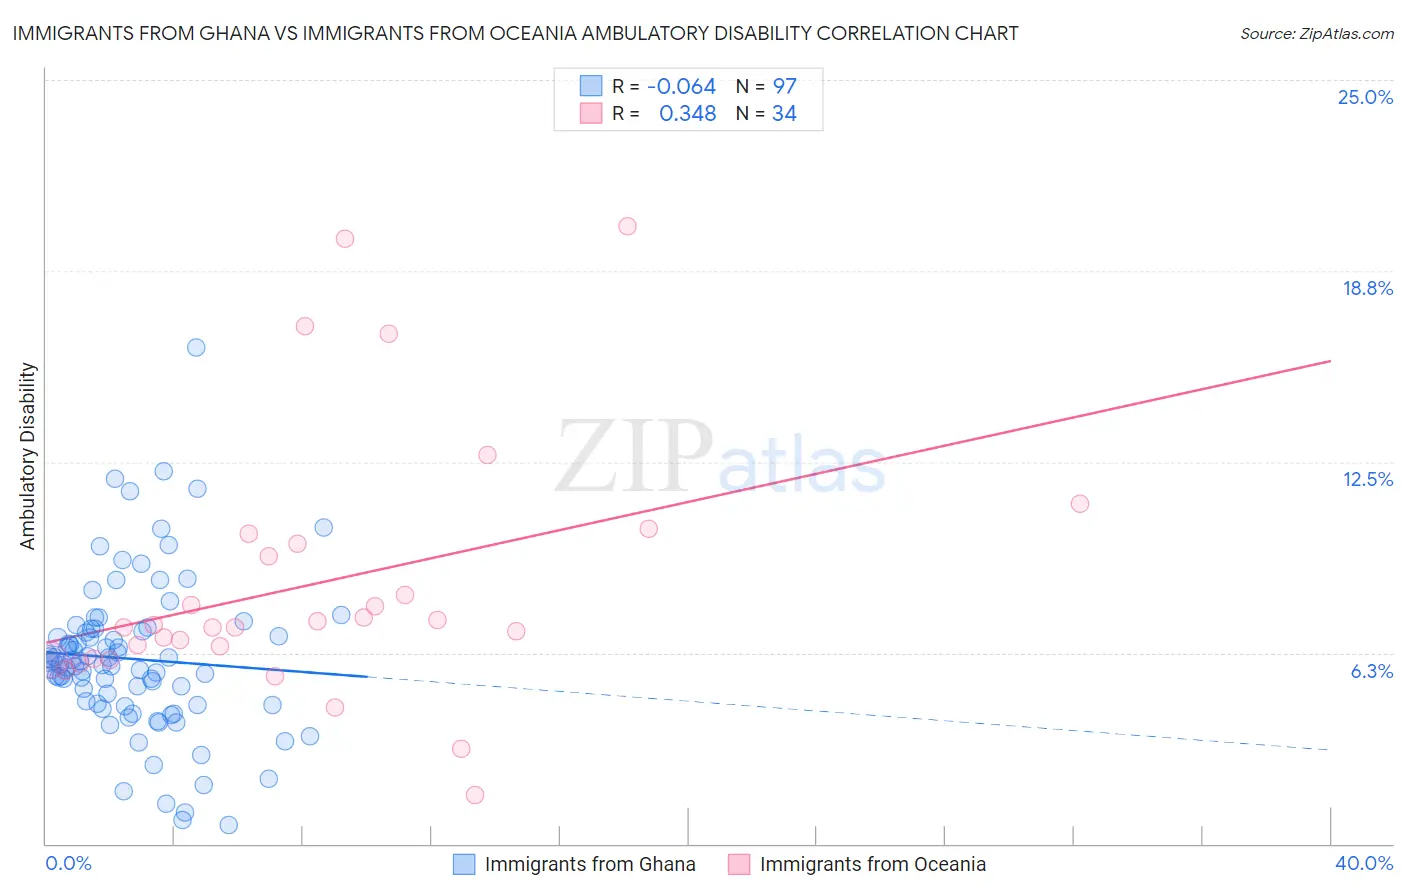
Immigrants from Ghana vs Immigrants from Oceania Ambulatory Disability Correlation Chart
The statistical analysis conducted on geographies consisting of 199,872,719 people shows a slight negative correlation between the proportion of Immigrants from Ghana and percentage of population with ambulatory disability in the United States with a correlation coefficient (R) of -0.064 and weighted average of 6.1%. Similarly, the statistical analysis conducted on geographies consisting of 305,408,228 people shows a mild positive correlation between the proportion of Immigrants from Oceania and percentage of population with ambulatory disability in the United States with a correlation coefficient (R) of 0.348 and weighted average of 6.1%, a difference of 1.1%.
Ambulatory Disability Correlation Summary
| Measurement | Immigrants from Ghana | Immigrants from Oceania |
| Minimum | 0.61% | 1.6% |
| Maximum | 16.2% | 20.2% |
| Range | 15.6% | 18.6% |
| Mean | 6.0% | 8.5% |
| Median | 5.9% | 7.1% |
| Interquartile 25% (IQ1) | 4.6% | 6.1% |
| Interquartile 75% (IQ3) | 7.0% | 9.8% |
| Interquartile Range (IQR) | 2.4% | 3.8% |
| Standard Deviation (Sample) | 2.5% | 4.3% |
| Standard Deviation (Population) | 2.5% | 4.2% |
Demographics Similar to Immigrants from Ghana and Immigrants from Oceania by Ambulatory Disability
In terms of ambulatory disability, the demographic groups most similar to Immigrants from Ghana are Immigrants from Thailand (6.1%, a difference of 0.050%), Serbian (6.1%, a difference of 0.090%), Swiss (6.1%, a difference of 0.10%), Austrian (6.1%, a difference of 0.15%), and Immigrants from Nicaragua (6.1%, a difference of 0.15%). Similarly, the demographic groups most similar to Immigrants from Oceania are Ecuadorian (6.1%, a difference of 0.010%), Iraqi (6.1%, a difference of 0.12%), Nicaraguan (6.1%, a difference of 0.14%), Immigrants from Southern Europe (6.1%, a difference of 0.15%), and Immigrants from Ecuador (6.1%, a difference of 0.38%).
| Demographics | Rating | Rank | Ambulatory Disability |
| Nicaraguans | 63.2 /100 | #165 | Good 6.1% |
| Iraqis | 62.8 /100 | #166 | Good 6.1% |
| Immigrants | Oceania | 60.7 /100 | #167 | Good 6.1% |
| Ecuadorians | 60.5 /100 | #168 | Good 6.1% |
| Immigrants | Southern Europe | 58.1 /100 | #169 | Average 6.1% |
| Immigrants | Ecuador | 53.8 /100 | #170 | Average 6.1% |
| Moroccans | 52.6 /100 | #171 | Average 6.1% |
| Immigrants | Burma/Myanmar | 52.2 /100 | #172 | Average 6.1% |
| Croatians | 51.2 /100 | #173 | Average 6.1% |
| Immigrants | Canada | 50.0 /100 | #174 | Average 6.1% |
| Vietnamese | 47.2 /100 | #175 | Average 6.1% |
| Immigrants | North America | 45.6 /100 | #176 | Average 6.1% |
| Immigrants | England | 45.4 /100 | #177 | Average 6.1% |
| Scandinavians | 44.5 /100 | #178 | Average 6.1% |
| Austrians | 44.1 /100 | #179 | Average 6.1% |
| Immigrants | Nicaragua | 43.9 /100 | #180 | Average 6.1% |
| Swiss | 43.1 /100 | #181 | Average 6.1% |
| Serbians | 42.8 /100 | #182 | Average 6.1% |
| Immigrants | Thailand | 42.2 /100 | #183 | Average 6.1% |
| Immigrants | Ghana | 41.2 /100 | #184 | Average 6.1% |
| Immigrants | Bosnia and Herzegovina | 37.2 /100 | #185 | Fair 6.2% |