Puget Sound Salish vs Menominee Male Disability
COMPARE
Puget Sound Salish
Menominee
Male Disability
Male Disability Comparison
Puget Sound Salish
Menominee
13.5%
MALE DISABILITY
0.0/ 100
METRIC RATING
313th/ 347
METRIC RANK
15.0%
MALE DISABILITY
0.0/ 100
METRIC RATING
337th/ 347
METRIC RANK
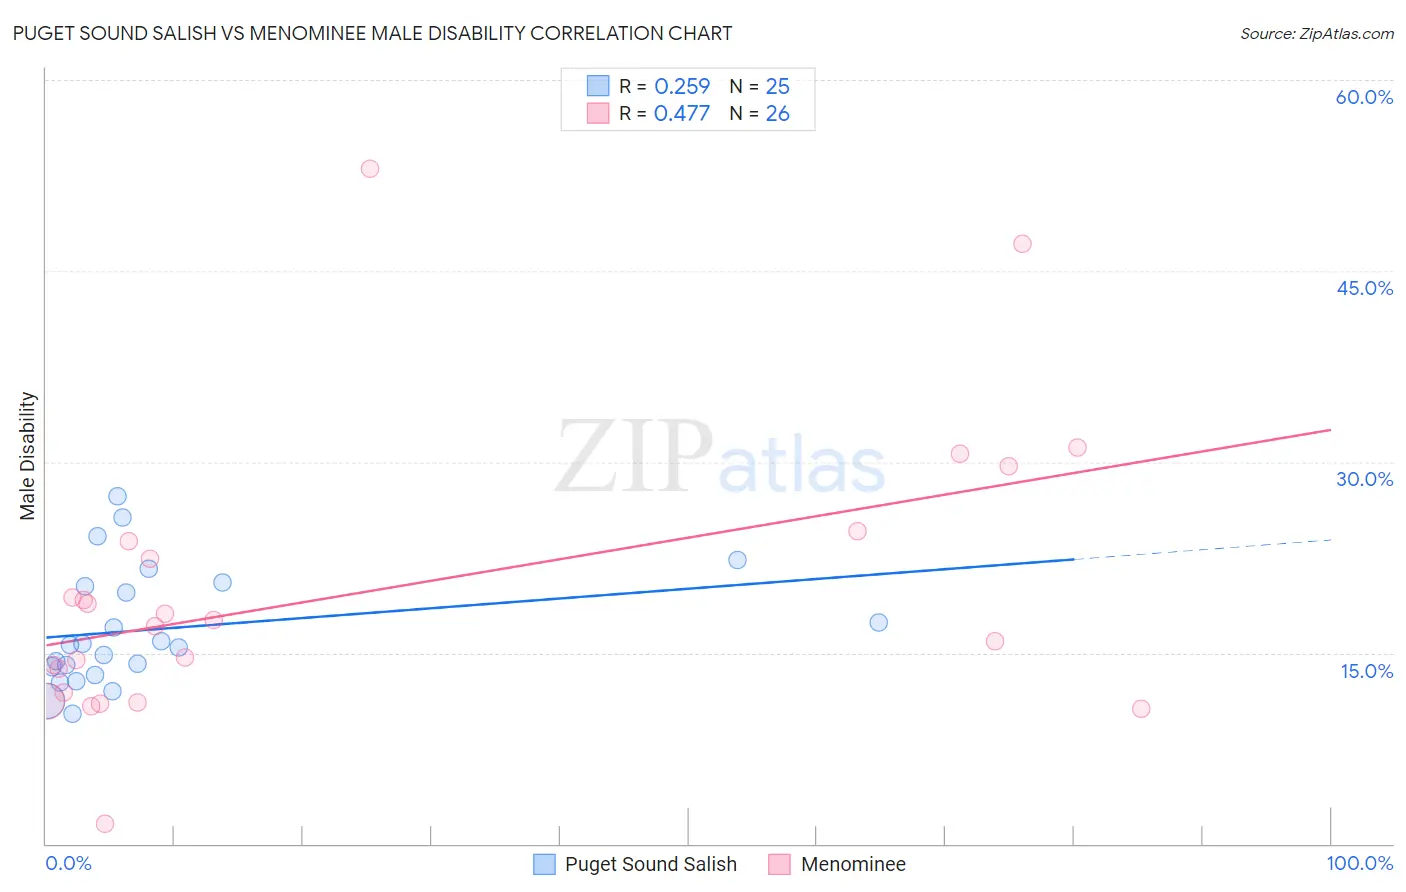
Puget Sound Salish vs Menominee Male Disability Correlation Chart
The statistical analysis conducted on geographies consisting of 46,152,398 people shows a weak positive correlation between the proportion of Puget Sound Salish and percentage of males with a disability in the United States with a correlation coefficient (R) of 0.259 and weighted average of 13.5%. Similarly, the statistical analysis conducted on geographies consisting of 45,777,737 people shows a moderate positive correlation between the proportion of Menominee and percentage of males with a disability in the United States with a correlation coefficient (R) of 0.477 and weighted average of 15.0%, a difference of 10.7%.
Male Disability Correlation Summary
| Measurement | Puget Sound Salish | Menominee |
| Minimum | 10.3% | 1.6% |
| Maximum | 27.3% | 53.0% |
| Range | 17.0% | 51.5% |
| Mean | 16.9% | 19.7% |
| Median | 15.6% | 17.4% |
| Interquartile 25% (IQ1) | 13.6% | 11.9% |
| Interquartile 75% (IQ3) | 20.4% | 23.8% |
| Interquartile Range (IQR) | 6.8% | 11.9% |
| Standard Deviation (Sample) | 4.6% | 11.3% |
| Standard Deviation (Population) | 4.5% | 11.1% |
Similar Demographics by Male Disability
Demographics Similar to Puget Sound Salish by Male Disability
In terms of male disability, the demographic groups most similar to Puget Sound Salish are Yakama (13.5%, a difference of 0.020%), Aleut (13.5%, a difference of 0.060%), Iroquois (13.6%, a difference of 0.22%), Alaska Native (13.6%, a difference of 0.27%), and Delaware (13.5%, a difference of 0.57%).
| Demographics | Rating | Rank | Male Disability |
| Spanish Americans | 0.0 /100 | #306 | Tragic 13.3% |
| Arapaho | 0.0 /100 | #307 | Tragic 13.3% |
| French American Indians | 0.0 /100 | #308 | Tragic 13.4% |
| Blackfeet | 0.0 /100 | #309 | Tragic 13.4% |
| Immigrants | Azores | 0.0 /100 | #310 | Tragic 13.4% |
| Delaware | 0.0 /100 | #311 | Tragic 13.5% |
| Yakama | 0.0 /100 | #312 | Tragic 13.5% |
| Puget Sound Salish | 0.0 /100 | #313 | Tragic 13.5% |
| Aleuts | 0.0 /100 | #314 | Tragic 13.5% |
| Iroquois | 0.0 /100 | #315 | Tragic 13.6% |
| Alaska Natives | 0.0 /100 | #316 | Tragic 13.6% |
| Paiute | 0.0 /100 | #317 | Tragic 13.7% |
| Cree | 0.0 /100 | #318 | Tragic 13.7% |
| Americans | 0.0 /100 | #319 | Tragic 13.8% |
| Tlingit-Haida | 0.0 /100 | #320 | Tragic 13.8% |
Demographics Similar to Menominee by Male Disability
In terms of male disability, the demographic groups most similar to Menominee are Pueblo (15.0%, a difference of 0.11%), Alaskan Athabascan (14.9%, a difference of 0.51%), Chickasaw (15.1%, a difference of 0.91%), Dutch West Indian (14.8%, a difference of 0.97%), and Cherokee (14.8%, a difference of 1.0%).
| Demographics | Rating | Rank | Male Disability |
| Navajo | 0.0 /100 | #330 | Tragic 14.4% |
| Tohono O'odham | 0.0 /100 | #331 | Tragic 14.6% |
| Seminole | 0.0 /100 | #332 | Tragic 14.7% |
| Yuman | 0.0 /100 | #333 | Tragic 14.7% |
| Cherokee | 0.0 /100 | #334 | Tragic 14.8% |
| Dutch West Indians | 0.0 /100 | #335 | Tragic 14.8% |
| Alaskan Athabascans | 0.0 /100 | #336 | Tragic 14.9% |
| Menominee | 0.0 /100 | #337 | Tragic 15.0% |
| Pueblo | 0.0 /100 | #338 | Tragic 15.0% |
| Chickasaw | 0.0 /100 | #339 | Tragic 15.1% |
| Lumbee | 0.0 /100 | #340 | Tragic 15.2% |
| Choctaw | 0.0 /100 | #341 | Tragic 15.4% |
| Kiowa | 0.0 /100 | #342 | Tragic 15.4% |
| Creek | 0.0 /100 | #343 | Tragic 15.5% |
| Puerto Ricans | 0.0 /100 | #344 | Tragic 15.6% |