Puget Sound Salish vs Immigrants from Burma/Myanmar Currently Married
COMPARE
Puget Sound Salish
Immigrants from Burma/Myanmar
Currently Married
Currently Married Comparison
Puget Sound Salish
Immigrants from Burma/Myanmar
47.6%
CURRENTLY MARRIED
90.3/ 100
METRIC RATING
117th/ 347
METRIC RANK
44.3%
CURRENTLY MARRIED
0.4/ 100
METRIC RATING
246th/ 347
METRIC RANK
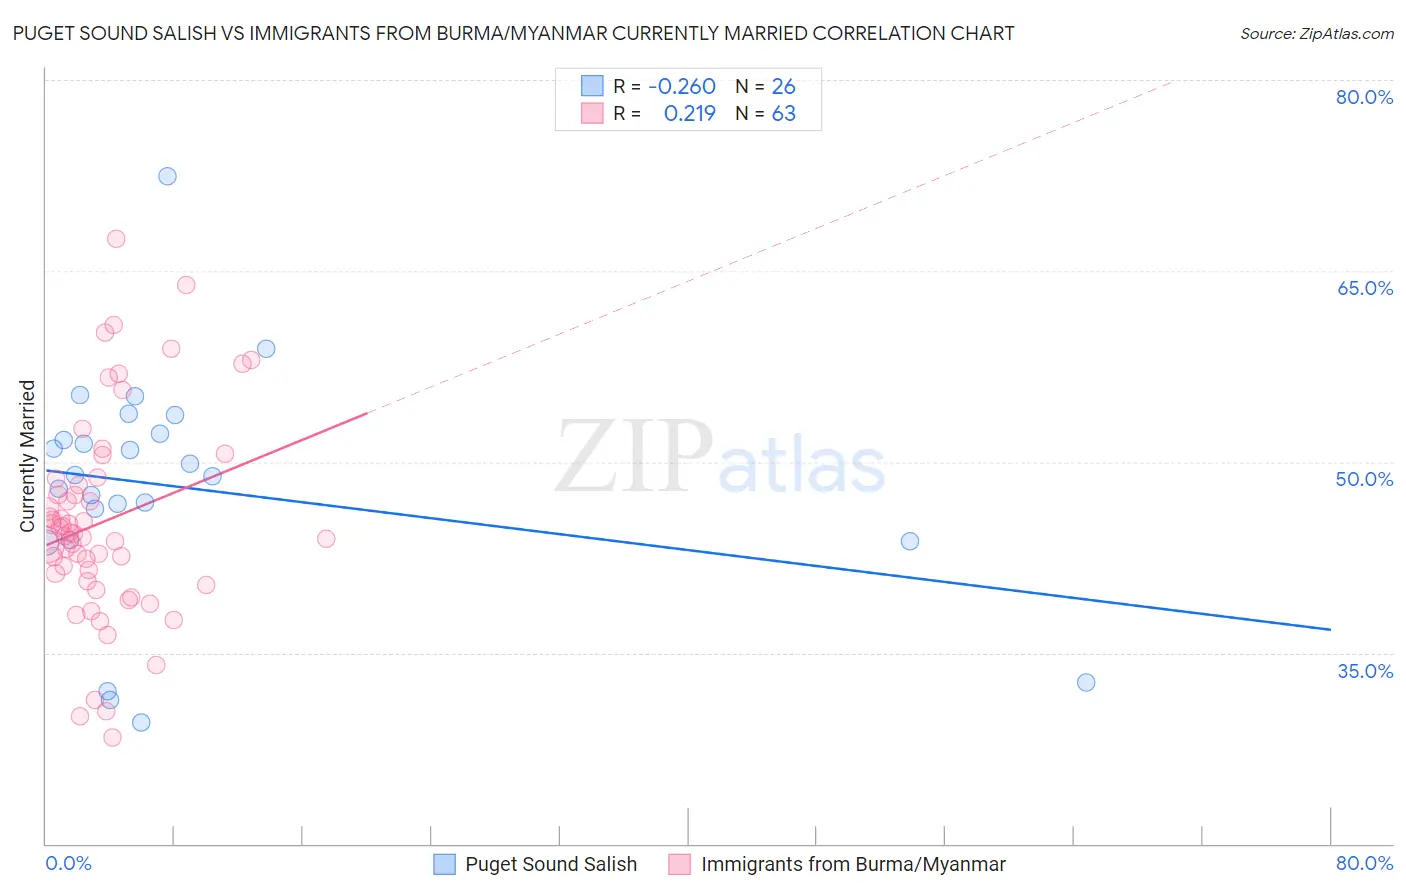
Puget Sound Salish vs Immigrants from Burma/Myanmar Currently Married Correlation Chart
The statistical analysis conducted on geographies consisting of 46,155,865 people shows a weak negative correlation between the proportion of Puget Sound Salish and percentage of population currently married in the United States with a correlation coefficient (R) of -0.260 and weighted average of 47.6%. Similarly, the statistical analysis conducted on geographies consisting of 172,355,169 people shows a weak positive correlation between the proportion of Immigrants from Burma/Myanmar and percentage of population currently married in the United States with a correlation coefficient (R) of 0.219 and weighted average of 44.3%, a difference of 7.4%.
Currently Married Correlation Summary
| Measurement | Puget Sound Salish | Immigrants from Burma/Myanmar |
| Minimum | 29.5% | 28.3% |
| Maximum | 72.4% | 67.5% |
| Range | 42.9% | 39.2% |
| Mean | 47.9% | 45.3% |
| Median | 48.9% | 44.3% |
| Interquartile 25% (IQ1) | 43.9% | 40.6% |
| Interquartile 75% (IQ3) | 52.2% | 48.7% |
| Interquartile Range (IQR) | 8.3% | 8.0% |
| Standard Deviation (Sample) | 9.2% | 8.1% |
| Standard Deviation (Population) | 9.0% | 8.0% |
Similar Demographics by Currently Married
Demographics Similar to Puget Sound Salish by Currently Married
In terms of currently married, the demographic groups most similar to Puget Sound Salish are Immigrants from Philippines (47.6%, a difference of 0.010%), Australian (47.6%, a difference of 0.010%), Immigrants from Indonesia (47.6%, a difference of 0.020%), Palestinian (47.6%, a difference of 0.020%), and South African (47.6%, a difference of 0.030%).
| Demographics | Rating | Rank | Currently Married |
| Immigrants | Russia | 92.0 /100 | #110 | Exceptional 47.7% |
| Immigrants | Hungary | 91.2 /100 | #111 | Exceptional 47.6% |
| Immigrants | Western Europe | 91.1 /100 | #112 | Exceptional 47.6% |
| Immigrants | Denmark | 90.9 /100 | #113 | Exceptional 47.6% |
| South Africans | 90.5 /100 | #114 | Exceptional 47.6% |
| Immigrants | Indonesia | 90.5 /100 | #115 | Exceptional 47.6% |
| Palestinians | 90.4 /100 | #116 | Exceptional 47.6% |
| Puget Sound Salish | 90.3 /100 | #117 | Exceptional 47.6% |
| Immigrants | Philippines | 90.2 /100 | #118 | Exceptional 47.6% |
| Australians | 90.2 /100 | #119 | Exceptional 47.6% |
| Syrians | 88.9 /100 | #120 | Excellent 47.5% |
| Immigrants | Croatia | 88.6 /100 | #121 | Excellent 47.5% |
| Osage | 87.9 /100 | #122 | Excellent 47.5% |
| Immigrants | Kazakhstan | 87.2 /100 | #123 | Excellent 47.4% |
| Laotians | 86.6 /100 | #124 | Excellent 47.4% |
Demographics Similar to Immigrants from Burma/Myanmar by Currently Married
In terms of currently married, the demographic groups most similar to Immigrants from Burma/Myanmar are Immigrants from Armenia (44.3%, a difference of 0.070%), Ugandan (44.2%, a difference of 0.13%), Nicaraguan (44.2%, a difference of 0.22%), Immigrants from Cameroon (44.2%, a difference of 0.24%), and Immigrants from Eastern Africa (44.2%, a difference of 0.26%).
| Demographics | Rating | Rank | Currently Married |
| Immigrants | Mexico | 0.7 /100 | #239 | Tragic 44.5% |
| Mexican American Indians | 0.7 /100 | #240 | Tragic 44.5% |
| Ethiopians | 0.7 /100 | #241 | Tragic 44.5% |
| Immigrants | Cambodia | 0.7 /100 | #242 | Tragic 44.5% |
| Immigrants | Ethiopia | 0.7 /100 | #243 | Tragic 44.5% |
| Japanese | 0.6 /100 | #244 | Tragic 44.5% |
| Immigrants | Armenia | 0.4 /100 | #245 | Tragic 44.3% |
| Immigrants | Burma/Myanmar | 0.4 /100 | #246 | Tragic 44.3% |
| Ugandans | 0.4 /100 | #247 | Tragic 44.2% |
| Nicaraguans | 0.3 /100 | #248 | Tragic 44.2% |
| Immigrants | Cameroon | 0.3 /100 | #249 | Tragic 44.2% |
| Immigrants | Eastern Africa | 0.3 /100 | #250 | Tragic 44.2% |
| Blackfeet | 0.3 /100 | #251 | Tragic 44.2% |
| Hispanics or Latinos | 0.3 /100 | #252 | Tragic 44.1% |
| Immigrants | Central America | 0.3 /100 | #253 | Tragic 44.1% |