Puget Sound Salish vs Immigrants from Western Africa Male Disability
COMPARE
Puget Sound Salish
Immigrants from Western Africa
Male Disability
Male Disability Comparison
Puget Sound Salish
Immigrants from Western Africa
13.5%
MALE DISABILITY
0.0/ 100
METRIC RATING
313th/ 347
METRIC RANK
11.1%
MALE DISABILITY
69.2/ 100
METRIC RATING
157th/ 347
METRIC RANK
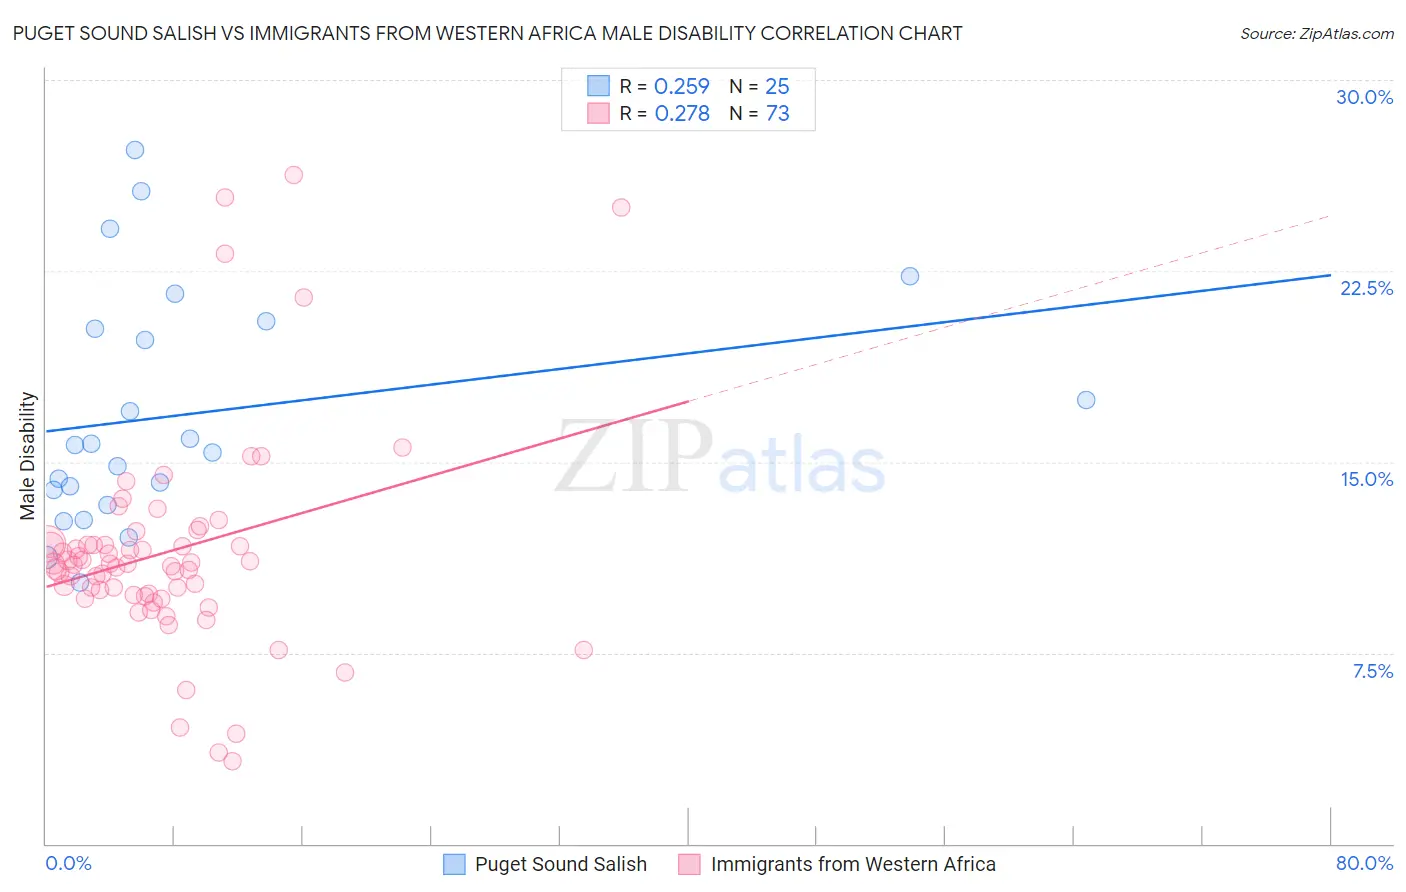
Puget Sound Salish vs Immigrants from Western Africa Male Disability Correlation Chart
The statistical analysis conducted on geographies consisting of 46,152,398 people shows a weak positive correlation between the proportion of Puget Sound Salish and percentage of males with a disability in the United States with a correlation coefficient (R) of 0.259 and weighted average of 13.5%. Similarly, the statistical analysis conducted on geographies consisting of 357,781,594 people shows a weak positive correlation between the proportion of Immigrants from Western Africa and percentage of males with a disability in the United States with a correlation coefficient (R) of 0.278 and weighted average of 11.1%, a difference of 22.1%.
Male Disability Correlation Summary
| Measurement | Puget Sound Salish | Immigrants from Western Africa |
| Minimum | 10.3% | 3.3% |
| Maximum | 27.3% | 26.3% |
| Range | 17.0% | 23.0% |
| Mean | 16.9% | 11.5% |
| Median | 15.6% | 11.0% |
| Interquartile 25% (IQ1) | 13.6% | 9.8% |
| Interquartile 75% (IQ3) | 20.4% | 11.8% |
| Interquartile Range (IQR) | 6.8% | 2.0% |
| Standard Deviation (Sample) | 4.6% | 4.2% |
| Standard Deviation (Population) | 4.5% | 4.2% |
Similar Demographics by Male Disability
Demographics Similar to Puget Sound Salish by Male Disability
In terms of male disability, the demographic groups most similar to Puget Sound Salish are Yakama (13.5%, a difference of 0.020%), Aleut (13.5%, a difference of 0.060%), Iroquois (13.6%, a difference of 0.22%), Alaska Native (13.6%, a difference of 0.27%), and Delaware (13.5%, a difference of 0.57%).
| Demographics | Rating | Rank | Male Disability |
| Spanish Americans | 0.0 /100 | #306 | Tragic 13.3% |
| Arapaho | 0.0 /100 | #307 | Tragic 13.3% |
| French American Indians | 0.0 /100 | #308 | Tragic 13.4% |
| Blackfeet | 0.0 /100 | #309 | Tragic 13.4% |
| Immigrants | Azores | 0.0 /100 | #310 | Tragic 13.4% |
| Delaware | 0.0 /100 | #311 | Tragic 13.5% |
| Yakama | 0.0 /100 | #312 | Tragic 13.5% |
| Puget Sound Salish | 0.0 /100 | #313 | Tragic 13.5% |
| Aleuts | 0.0 /100 | #314 | Tragic 13.5% |
| Iroquois | 0.0 /100 | #315 | Tragic 13.6% |
| Alaska Natives | 0.0 /100 | #316 | Tragic 13.6% |
| Paiute | 0.0 /100 | #317 | Tragic 13.7% |
| Cree | 0.0 /100 | #318 | Tragic 13.7% |
| Americans | 0.0 /100 | #319 | Tragic 13.8% |
| Tlingit-Haida | 0.0 /100 | #320 | Tragic 13.8% |
Demographics Similar to Immigrants from Western Africa by Male Disability
In terms of male disability, the demographic groups most similar to Immigrants from Western Africa are Russian (11.1%, a difference of 0.040%), Latvian (11.1%, a difference of 0.070%), Immigrants from Middle Africa (11.1%, a difference of 0.11%), Guatemalan (11.1%, a difference of 0.13%), and Albanian (11.1%, a difference of 0.18%).
| Demographics | Rating | Rank | Male Disability |
| Immigrants | Guatemala | 75.1 /100 | #150 | Good 11.0% |
| Cubans | 74.9 /100 | #151 | Good 11.0% |
| Immigrants | Albania | 74.4 /100 | #152 | Good 11.0% |
| Immigrants | Northern Europe | 73.2 /100 | #153 | Good 11.1% |
| Immigrants | Moldova | 72.8 /100 | #154 | Good 11.1% |
| Immigrants | Middle Africa | 70.9 /100 | #155 | Good 11.1% |
| Russians | 69.8 /100 | #156 | Good 11.1% |
| Immigrants | Western Africa | 69.2 /100 | #157 | Good 11.1% |
| Latvians | 68.1 /100 | #158 | Good 11.1% |
| Guatemalans | 67.2 /100 | #159 | Good 11.1% |
| Albanians | 66.5 /100 | #160 | Good 11.1% |
| Immigrants | West Indies | 65.7 /100 | #161 | Good 11.1% |
| Immigrants | Haiti | 65.3 /100 | #162 | Good 11.1% |
| Immigrants | Kenya | 63.8 /100 | #163 | Good 11.1% |
| British West Indians | 62.8 /100 | #164 | Good 11.1% |