Puget Sound Salish vs Immigrants from Burma/Myanmar 7th Grade
COMPARE
Puget Sound Salish
Immigrants from Burma/Myanmar
7th Grade
7th Grade Comparison
Puget Sound Salish
Immigrants from Burma/Myanmar
96.7%
7TH GRADE
99.0/ 100
METRIC RATING
88th/ 347
METRIC RANK
94.5%
7TH GRADE
0.0/ 100
METRIC RATING
300th/ 347
METRIC RANK
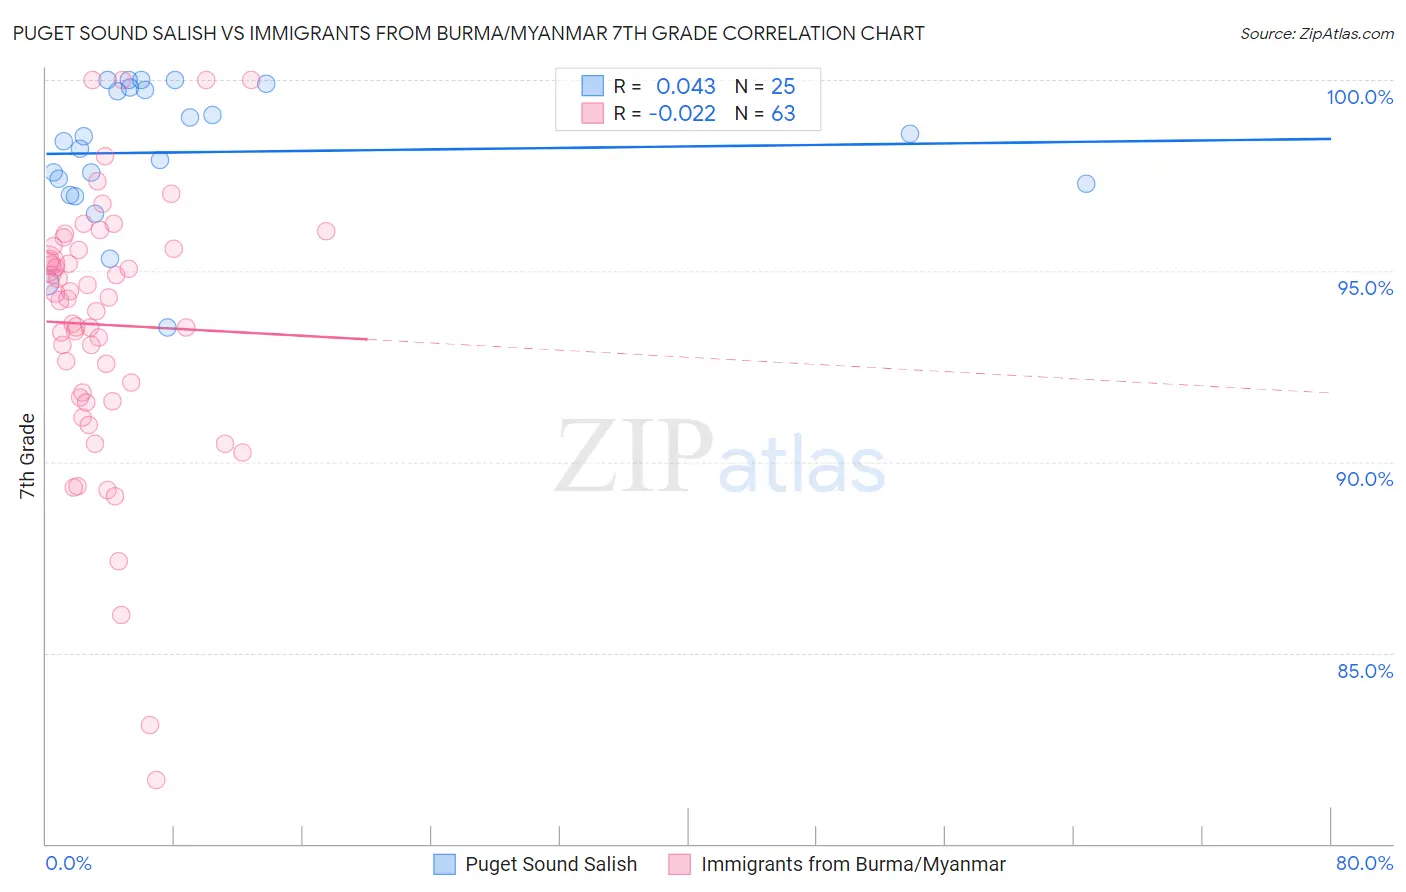
Puget Sound Salish vs Immigrants from Burma/Myanmar 7th Grade Correlation Chart
The statistical analysis conducted on geographies consisting of 46,155,775 people shows no correlation between the proportion of Puget Sound Salish and percentage of population with at least 7th grade education in the United States with a correlation coefficient (R) of 0.043 and weighted average of 96.7%. Similarly, the statistical analysis conducted on geographies consisting of 172,345,696 people shows no correlation between the proportion of Immigrants from Burma/Myanmar and percentage of population with at least 7th grade education in the United States with a correlation coefficient (R) of -0.022 and weighted average of 94.5%, a difference of 2.4%.
7th Grade Correlation Summary
| Measurement | Puget Sound Salish | Immigrants from Burma/Myanmar |
| Minimum | 93.5% | 81.7% |
| Maximum | 100.0% | 100.0% |
| Range | 6.5% | 18.3% |
| Mean | 98.1% | 93.6% |
| Median | 98.4% | 94.3% |
| Interquartile 25% (IQ1) | 97.1% | 91.7% |
| Interquartile 75% (IQ3) | 99.8% | 95.6% |
| Interquartile Range (IQR) | 2.6% | 3.9% |
| Standard Deviation (Sample) | 1.8% | 3.6% |
| Standard Deviation (Population) | 1.7% | 3.5% |
Similar Demographics by 7th Grade
Demographics Similar to Puget Sound Salish by 7th Grade
In terms of 7th grade, the demographic groups most similar to Puget Sound Salish are Immigrants from Belgium (96.7%, a difference of 0.0%), Cree (96.7%, a difference of 0.0%), Turkish (96.7%, a difference of 0.010%), Immigrants from South Africa (96.7%, a difference of 0.010%), and Osage (96.7%, a difference of 0.010%).
| Demographics | Rating | Rank | 7th Grade |
| Delaware | 99.2 /100 | #81 | Exceptional 96.8% |
| Chickasaw | 99.2 /100 | #82 | Exceptional 96.7% |
| Icelanders | 99.1 /100 | #83 | Exceptional 96.7% |
| Romanians | 99.1 /100 | #84 | Exceptional 96.7% |
| Kiowa | 99.1 /100 | #85 | Exceptional 96.7% |
| Turks | 99.1 /100 | #86 | Exceptional 96.7% |
| Immigrants | Belgium | 99.0 /100 | #87 | Exceptional 96.7% |
| Puget Sound Salish | 99.0 /100 | #88 | Exceptional 96.7% |
| Cree | 99.0 /100 | #89 | Exceptional 96.7% |
| Immigrants | South Africa | 98.9 /100 | #90 | Exceptional 96.7% |
| Osage | 98.9 /100 | #91 | Exceptional 96.7% |
| Immigrants | Western Europe | 98.9 /100 | #92 | Exceptional 96.7% |
| Potawatomi | 98.9 /100 | #93 | Exceptional 96.7% |
| Lebanese | 98.8 /100 | #94 | Exceptional 96.7% |
| Immigrants | Australia | 98.8 /100 | #95 | Exceptional 96.7% |
Demographics Similar to Immigrants from Burma/Myanmar by 7th Grade
In terms of 7th grade, the demographic groups most similar to Immigrants from Burma/Myanmar are Immigrants from Dominica (94.5%, a difference of 0.030%), Immigrants from Laos (94.5%, a difference of 0.030%), Immigrants from South Eastern Asia (94.5%, a difference of 0.040%), Indonesian (94.5%, a difference of 0.040%), and Bangladeshi (94.5%, a difference of 0.040%).
| Demographics | Rating | Rank | 7th Grade |
| Fijians | 0.0 /100 | #293 | Tragic 94.7% |
| Haitians | 0.0 /100 | #294 | Tragic 94.7% |
| Yaqui | 0.0 /100 | #295 | Tragic 94.6% |
| Cubans | 0.0 /100 | #296 | Tragic 94.6% |
| Immigrants | South Eastern Asia | 0.0 /100 | #297 | Tragic 94.5% |
| Indonesians | 0.0 /100 | #298 | Tragic 94.5% |
| Bangladeshis | 0.0 /100 | #299 | Tragic 94.5% |
| Immigrants | Burma/Myanmar | 0.0 /100 | #300 | Tragic 94.5% |
| Immigrants | Dominica | 0.0 /100 | #301 | Tragic 94.5% |
| Immigrants | Laos | 0.0 /100 | #302 | Tragic 94.5% |
| Sri Lankans | 0.0 /100 | #303 | Tragic 94.4% |
| Immigrants | Haiti | 0.0 /100 | #304 | Tragic 94.3% |
| Guyanese | 0.0 /100 | #305 | Tragic 94.3% |
| Immigrants | Guyana | 0.0 /100 | #306 | Tragic 94.2% |
| Immigrants | Portugal | 0.0 /100 | #307 | Tragic 94.2% |