Puget Sound Salish vs Immigrants from Burma/Myanmar No Vehicles in Household
COMPARE
Puget Sound Salish
Immigrants from Burma/Myanmar
No Vehicles in Household
No Vehicles in Household Comparison
Puget Sound Salish
Immigrants from Burma/Myanmar
9.5%
NO VEHICLES IN HOUSEHOLD
92.4/ 100
METRIC RATING
121st/ 347
METRIC RANK
10.4%
NO VEHICLES IN HOUSEHOLD
49.1/ 100
METRIC RATING
175th/ 347
METRIC RANK
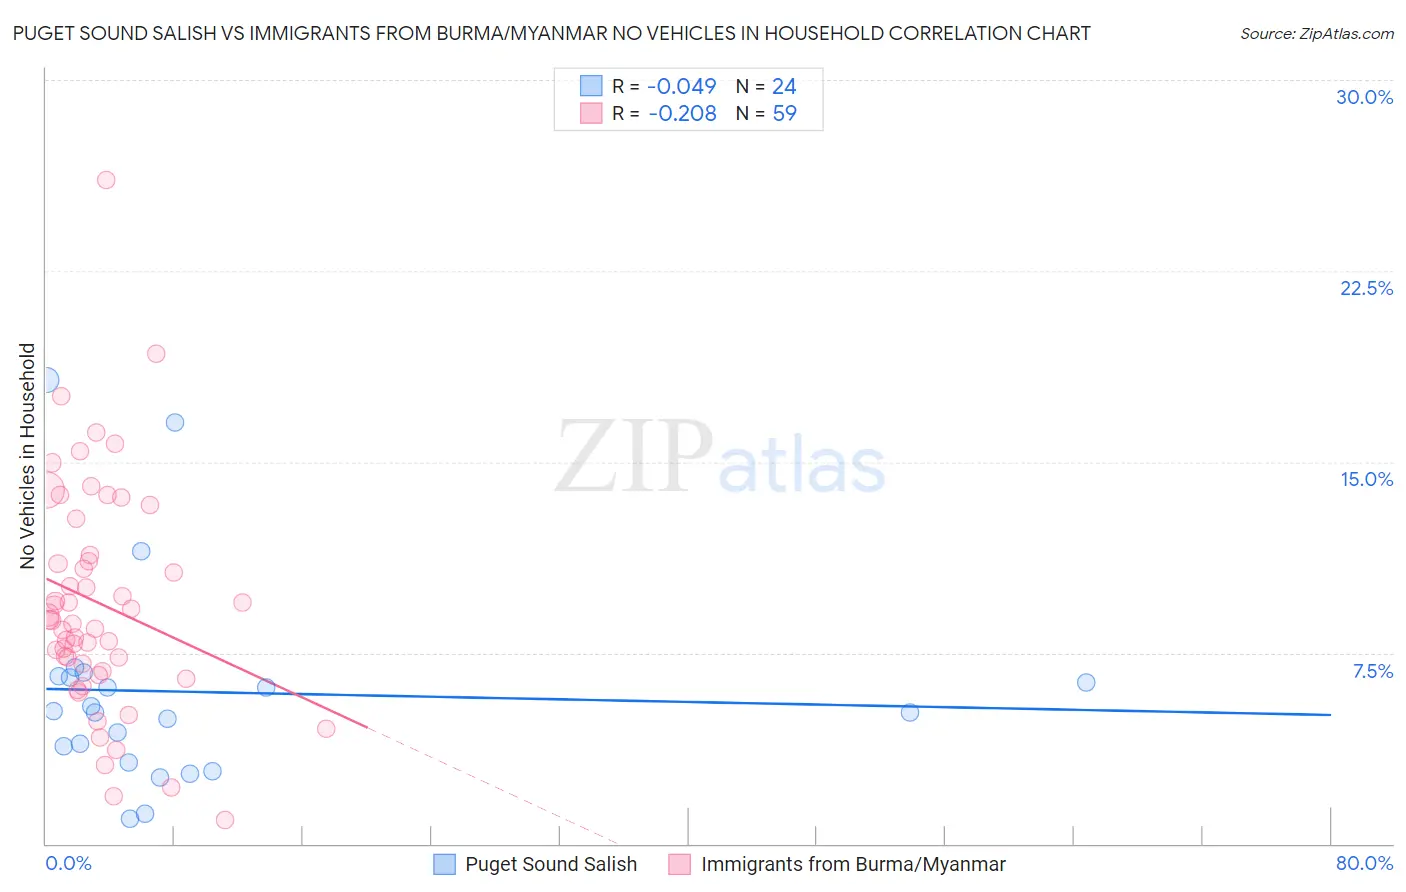
Puget Sound Salish vs Immigrants from Burma/Myanmar No Vehicles in Household Correlation Chart
The statistical analysis conducted on geographies consisting of 46,140,231 people shows no correlation between the proportion of Puget Sound Salish and percentage of households with no vehicle available in the United States with a correlation coefficient (R) of -0.049 and weighted average of 9.5%. Similarly, the statistical analysis conducted on geographies consisting of 172,182,112 people shows a weak negative correlation between the proportion of Immigrants from Burma/Myanmar and percentage of households with no vehicle available in the United States with a correlation coefficient (R) of -0.208 and weighted average of 10.4%, a difference of 9.4%.
No Vehicles in Household Correlation Summary
| Measurement | Puget Sound Salish | Immigrants from Burma/Myanmar |
| Minimum | 0.96% | 0.91% |
| Maximum | 18.2% | 26.1% |
| Range | 17.3% | 25.1% |
| Mean | 6.0% | 9.4% |
| Median | 5.2% | 8.8% |
| Interquartile 25% (IQ1) | 3.5% | 6.8% |
| Interquartile 75% (IQ3) | 6.5% | 11.3% |
| Interquartile Range (IQR) | 3.0% | 4.6% |
| Standard Deviation (Sample) | 4.2% | 4.5% |
| Standard Deviation (Population) | 4.1% | 4.5% |
Similar Demographics by No Vehicles in Household
Demographics Similar to Puget Sound Salish by No Vehicles in Household
In terms of no vehicles in household, the demographic groups most similar to Puget Sound Salish are Costa Rican (9.5%, a difference of 0.050%), Immigrants from Thailand (9.5%, a difference of 0.10%), Fijian (9.5%, a difference of 0.16%), Greek (9.5%, a difference of 0.27%), and Blackfeet (9.6%, a difference of 0.51%).
| Demographics | Rating | Rank | No Vehicles in Household |
| Serbians | 94.3 /100 | #114 | Exceptional 9.4% |
| Navajo | 94.2 /100 | #115 | Exceptional 9.4% |
| Japanese | 94.1 /100 | #116 | Exceptional 9.4% |
| Chippewa | 93.8 /100 | #117 | Exceptional 9.4% |
| Greeks | 92.9 /100 | #118 | Exceptional 9.5% |
| Fijians | 92.7 /100 | #119 | Exceptional 9.5% |
| Immigrants | Thailand | 92.6 /100 | #120 | Exceptional 9.5% |
| Puget Sound Salish | 92.4 /100 | #121 | Exceptional 9.5% |
| Costa Ricans | 92.3 /100 | #122 | Exceptional 9.5% |
| Blackfeet | 91.4 /100 | #123 | Exceptional 9.6% |
| Immigrants | Korea | 90.9 /100 | #124 | Exceptional 9.6% |
| Immigrants | Cameroon | 90.6 /100 | #125 | Exceptional 9.6% |
| Icelanders | 90.2 /100 | #126 | Exceptional 9.6% |
| Immigrants | Kenya | 89.7 /100 | #127 | Excellent 9.6% |
| Immigrants | Syria | 89.5 /100 | #128 | Excellent 9.6% |
Demographics Similar to Immigrants from Burma/Myanmar by No Vehicles in Household
In terms of no vehicles in household, the demographic groups most similar to Immigrants from Burma/Myanmar are French American Indian (10.4%, a difference of 0.0%), Immigrants from El Salvador (10.4%, a difference of 0.010%), Immigrants from Sudan (10.4%, a difference of 0.12%), Filipino (10.4%, a difference of 0.13%), and Immigrants from Ethiopia (10.4%, a difference of 0.16%).
| Demographics | Rating | Rank | No Vehicles in Household |
| Indonesians | 56.7 /100 | #168 | Average 10.3% |
| Lumbee | 54.7 /100 | #169 | Average 10.3% |
| Immigrants | Latin America | 53.2 /100 | #170 | Average 10.4% |
| Hmong | 52.7 /100 | #171 | Average 10.4% |
| Brazilians | 51.7 /100 | #172 | Average 10.4% |
| Filipinos | 50.1 /100 | #173 | Average 10.4% |
| Immigrants | Sudan | 50.0 /100 | #174 | Average 10.4% |
| Immigrants | Burma/Myanmar | 49.1 /100 | #175 | Average 10.4% |
| French American Indians | 49.1 /100 | #176 | Average 10.4% |
| Immigrants | El Salvador | 49.1 /100 | #177 | Average 10.4% |
| Immigrants | Ethiopia | 48.0 /100 | #178 | Average 10.4% |
| Ethiopians | 45.8 /100 | #179 | Average 10.5% |
| Arabs | 45.3 /100 | #180 | Average 10.5% |
| Immigrants | Colombia | 44.1 /100 | #181 | Average 10.5% |
| Immigrants | Bulgaria | 43.8 /100 | #182 | Average 10.5% |