Puget Sound Salish vs English Male Disability
COMPARE
Puget Sound Salish
English
Male Disability
Male Disability Comparison
Puget Sound Salish
English
13.5%
MALE DISABILITY
0.0/ 100
METRIC RATING
313th/ 347
METRIC RANK
12.8%
MALE DISABILITY
0.0/ 100
METRIC RATING
292nd/ 347
METRIC RANK
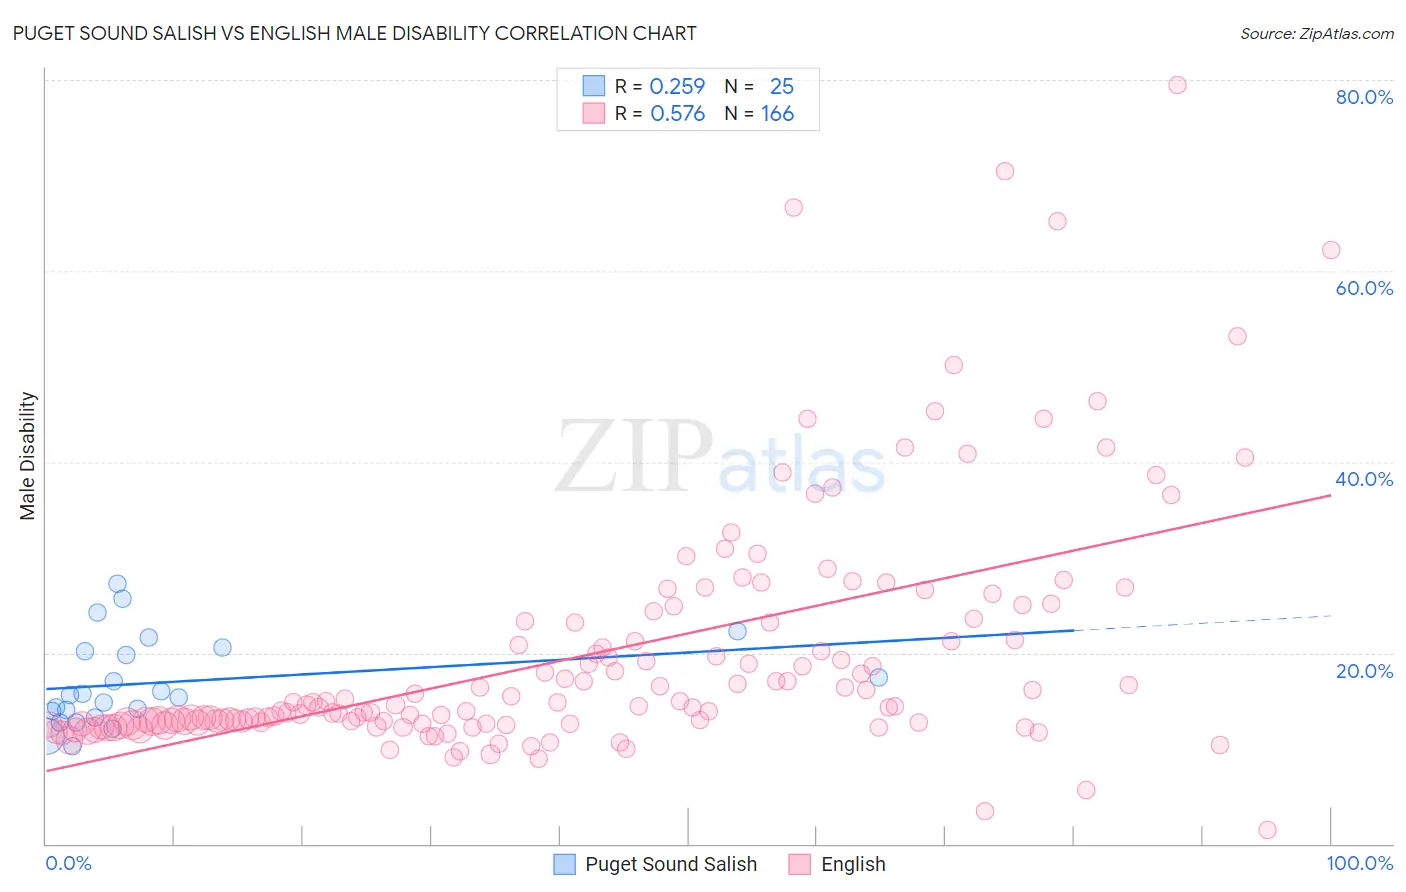
Puget Sound Salish vs English Male Disability Correlation Chart
The statistical analysis conducted on geographies consisting of 46,152,398 people shows a weak positive correlation between the proportion of Puget Sound Salish and percentage of males with a disability in the United States with a correlation coefficient (R) of 0.259 and weighted average of 13.5%. Similarly, the statistical analysis conducted on geographies consisting of 579,503,063 people shows a substantial positive correlation between the proportion of English and percentage of males with a disability in the United States with a correlation coefficient (R) of 0.576 and weighted average of 12.8%, a difference of 5.4%.
Male Disability Correlation Summary
| Measurement | Puget Sound Salish | English |
| Minimum | 10.3% | 1.4% |
| Maximum | 27.3% | 79.4% |
| Range | 17.0% | 78.0% |
| Mean | 16.9% | 19.9% |
| Median | 15.6% | 14.4% |
| Interquartile 25% (IQ1) | 13.6% | 12.6% |
| Interquartile 75% (IQ3) | 20.4% | 23.2% |
| Interquartile Range (IQR) | 6.8% | 10.6% |
| Standard Deviation (Sample) | 4.6% | 12.8% |
| Standard Deviation (Population) | 4.5% | 12.8% |
Similar Demographics by Male Disability
Demographics Similar to Puget Sound Salish by Male Disability
In terms of male disability, the demographic groups most similar to Puget Sound Salish are Yakama (13.5%, a difference of 0.020%), Aleut (13.5%, a difference of 0.060%), Iroquois (13.6%, a difference of 0.22%), Alaska Native (13.6%, a difference of 0.27%), and Delaware (13.5%, a difference of 0.57%).
| Demographics | Rating | Rank | Male Disability |
| Spanish Americans | 0.0 /100 | #306 | Tragic 13.3% |
| Arapaho | 0.0 /100 | #307 | Tragic 13.3% |
| French American Indians | 0.0 /100 | #308 | Tragic 13.4% |
| Blackfeet | 0.0 /100 | #309 | Tragic 13.4% |
| Immigrants | Azores | 0.0 /100 | #310 | Tragic 13.4% |
| Delaware | 0.0 /100 | #311 | Tragic 13.5% |
| Yakama | 0.0 /100 | #312 | Tragic 13.5% |
| Puget Sound Salish | 0.0 /100 | #313 | Tragic 13.5% |
| Aleuts | 0.0 /100 | #314 | Tragic 13.5% |
| Iroquois | 0.0 /100 | #315 | Tragic 13.6% |
| Alaska Natives | 0.0 /100 | #316 | Tragic 13.6% |
| Paiute | 0.0 /100 | #317 | Tragic 13.7% |
| Cree | 0.0 /100 | #318 | Tragic 13.7% |
| Americans | 0.0 /100 | #319 | Tragic 13.8% |
| Tlingit-Haida | 0.0 /100 | #320 | Tragic 13.8% |
Demographics Similar to English by Male Disability
In terms of male disability, the demographic groups most similar to English are White/Caucasian (12.8%, a difference of 0.060%), Pima (12.8%, a difference of 0.15%), Yaqui (12.9%, a difference of 0.29%), Immigrants from Cabo Verde (12.8%, a difference of 0.30%), and Yup'ik (12.8%, a difference of 0.49%).
| Demographics | Rating | Rank | Male Disability |
| Welsh | 0.0 /100 | #285 | Tragic 12.7% |
| Scottish | 0.0 /100 | #286 | Tragic 12.8% |
| Cape Verdeans | 0.0 /100 | #287 | Tragic 12.8% |
| Yup'ik | 0.0 /100 | #288 | Tragic 12.8% |
| Immigrants | Cabo Verde | 0.0 /100 | #289 | Tragic 12.8% |
| Pima | 0.0 /100 | #290 | Tragic 12.8% |
| Whites/Caucasians | 0.0 /100 | #291 | Tragic 12.8% |
| English | 0.0 /100 | #292 | Tragic 12.8% |
| Yaqui | 0.0 /100 | #293 | Tragic 12.9% |
| Marshallese | 0.0 /100 | #294 | Tragic 12.9% |
| Immigrants | Micronesia | 0.0 /100 | #295 | Tragic 12.9% |
| Immigrants | Nonimmigrants | 0.0 /100 | #296 | Tragic 12.9% |
| Inupiat | 0.0 /100 | #297 | Tragic 13.0% |
| Pennsylvania Germans | 0.0 /100 | #298 | Tragic 13.0% |
| Celtics | 0.0 /100 | #299 | Tragic 13.0% |