Puget Sound Salish vs Immigrants from Hong Kong Male Disability
COMPARE
Puget Sound Salish
Immigrants from Hong Kong
Male Disability
Male Disability Comparison
Puget Sound Salish
Immigrants from Hong Kong
13.5%
MALE DISABILITY
0.0/ 100
METRIC RATING
313th/ 347
METRIC RANK
9.4%
MALE DISABILITY
100.0/ 100
METRIC RATING
5th/ 347
METRIC RANK
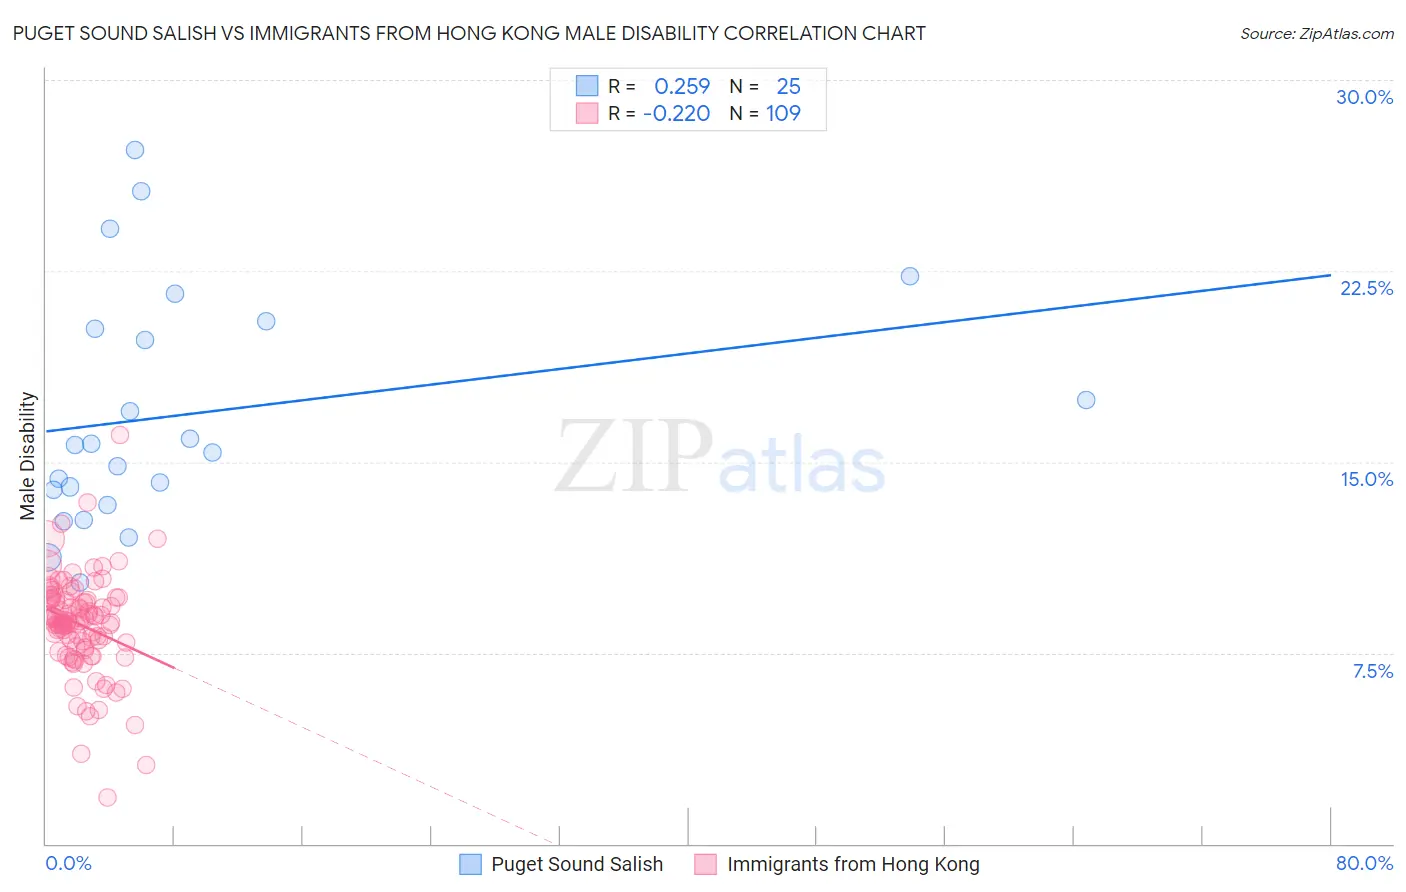
Puget Sound Salish vs Immigrants from Hong Kong Male Disability Correlation Chart
The statistical analysis conducted on geographies consisting of 46,152,398 people shows a weak positive correlation between the proportion of Puget Sound Salish and percentage of males with a disability in the United States with a correlation coefficient (R) of 0.259 and weighted average of 13.5%. Similarly, the statistical analysis conducted on geographies consisting of 253,984,960 people shows a weak negative correlation between the proportion of Immigrants from Hong Kong and percentage of males with a disability in the United States with a correlation coefficient (R) of -0.220 and weighted average of 9.4%, a difference of 43.7%.
Male Disability Correlation Summary
| Measurement | Puget Sound Salish | Immigrants from Hong Kong |
| Minimum | 10.3% | 1.8% |
| Maximum | 27.3% | 16.1% |
| Range | 17.0% | 14.3% |
| Mean | 16.9% | 8.6% |
| Median | 15.6% | 8.7% |
| Interquartile 25% (IQ1) | 13.6% | 7.8% |
| Interquartile 75% (IQ3) | 20.4% | 9.6% |
| Interquartile Range (IQR) | 6.8% | 1.9% |
| Standard Deviation (Sample) | 4.6% | 2.0% |
| Standard Deviation (Population) | 4.5% | 1.9% |
Similar Demographics by Male Disability
Demographics Similar to Puget Sound Salish by Male Disability
In terms of male disability, the demographic groups most similar to Puget Sound Salish are Yakama (13.5%, a difference of 0.020%), Aleut (13.5%, a difference of 0.060%), Iroquois (13.6%, a difference of 0.22%), Alaska Native (13.6%, a difference of 0.27%), and Delaware (13.5%, a difference of 0.57%).
| Demographics | Rating | Rank | Male Disability |
| Spanish Americans | 0.0 /100 | #306 | Tragic 13.3% |
| Arapaho | 0.0 /100 | #307 | Tragic 13.3% |
| French American Indians | 0.0 /100 | #308 | Tragic 13.4% |
| Blackfeet | 0.0 /100 | #309 | Tragic 13.4% |
| Immigrants | Azores | 0.0 /100 | #310 | Tragic 13.4% |
| Delaware | 0.0 /100 | #311 | Tragic 13.5% |
| Yakama | 0.0 /100 | #312 | Tragic 13.5% |
| Puget Sound Salish | 0.0 /100 | #313 | Tragic 13.5% |
| Aleuts | 0.0 /100 | #314 | Tragic 13.5% |
| Iroquois | 0.0 /100 | #315 | Tragic 13.6% |
| Alaska Natives | 0.0 /100 | #316 | Tragic 13.6% |
| Paiute | 0.0 /100 | #317 | Tragic 13.7% |
| Cree | 0.0 /100 | #318 | Tragic 13.7% |
| Americans | 0.0 /100 | #319 | Tragic 13.8% |
| Tlingit-Haida | 0.0 /100 | #320 | Tragic 13.8% |
Demographics Similar to Immigrants from Hong Kong by Male Disability
In terms of male disability, the demographic groups most similar to Immigrants from Hong Kong are Immigrants from South Central Asia (9.4%, a difference of 0.060%), Immigrants from Bolivia (9.5%, a difference of 0.39%), Immigrants from China (9.5%, a difference of 0.99%), Immigrants from Singapore (9.5%, a difference of 1.1%), and Immigrants from Israel (9.6%, a difference of 1.5%).
| Demographics | Rating | Rank | Male Disability |
| Immigrants | India | 100.0 /100 | #1 | Exceptional 9.0% |
| Immigrants | Taiwan | 100.0 /100 | #2 | Exceptional 9.1% |
| Filipinos | 100.0 /100 | #3 | Exceptional 9.1% |
| Thais | 100.0 /100 | #4 | Exceptional 9.2% |
| Immigrants | Hong Kong | 100.0 /100 | #5 | Exceptional 9.4% |
| Immigrants | South Central Asia | 100.0 /100 | #6 | Exceptional 9.4% |
| Immigrants | Bolivia | 100.0 /100 | #7 | Exceptional 9.5% |
| Immigrants | China | 100.0 /100 | #8 | Exceptional 9.5% |
| Immigrants | Singapore | 100.0 /100 | #9 | Exceptional 9.5% |
| Immigrants | Israel | 100.0 /100 | #10 | Exceptional 9.6% |
| Immigrants | Eastern Asia | 100.0 /100 | #11 | Exceptional 9.6% |
| Bolivians | 100.0 /100 | #12 | Exceptional 9.6% |
| Iranians | 100.0 /100 | #13 | Exceptional 9.7% |
| Immigrants | Iran | 100.0 /100 | #14 | Exceptional 9.7% |
| Indians (Asian) | 100.0 /100 | #15 | Exceptional 9.7% |