Ottawa vs Immigrants from Czechoslovakia Male Disability
COMPARE
Ottawa
Immigrants from Czechoslovakia
Male Disability
Male Disability Comparison
Ottawa
Immigrants from Czechoslovakia
14.1%
MALE DISABILITY
0.0/ 100
METRIC RATING
325th/ 347
METRIC RANK
10.9%
MALE DISABILITY
88.4/ 100
METRIC RATING
123rd/ 347
METRIC RANK
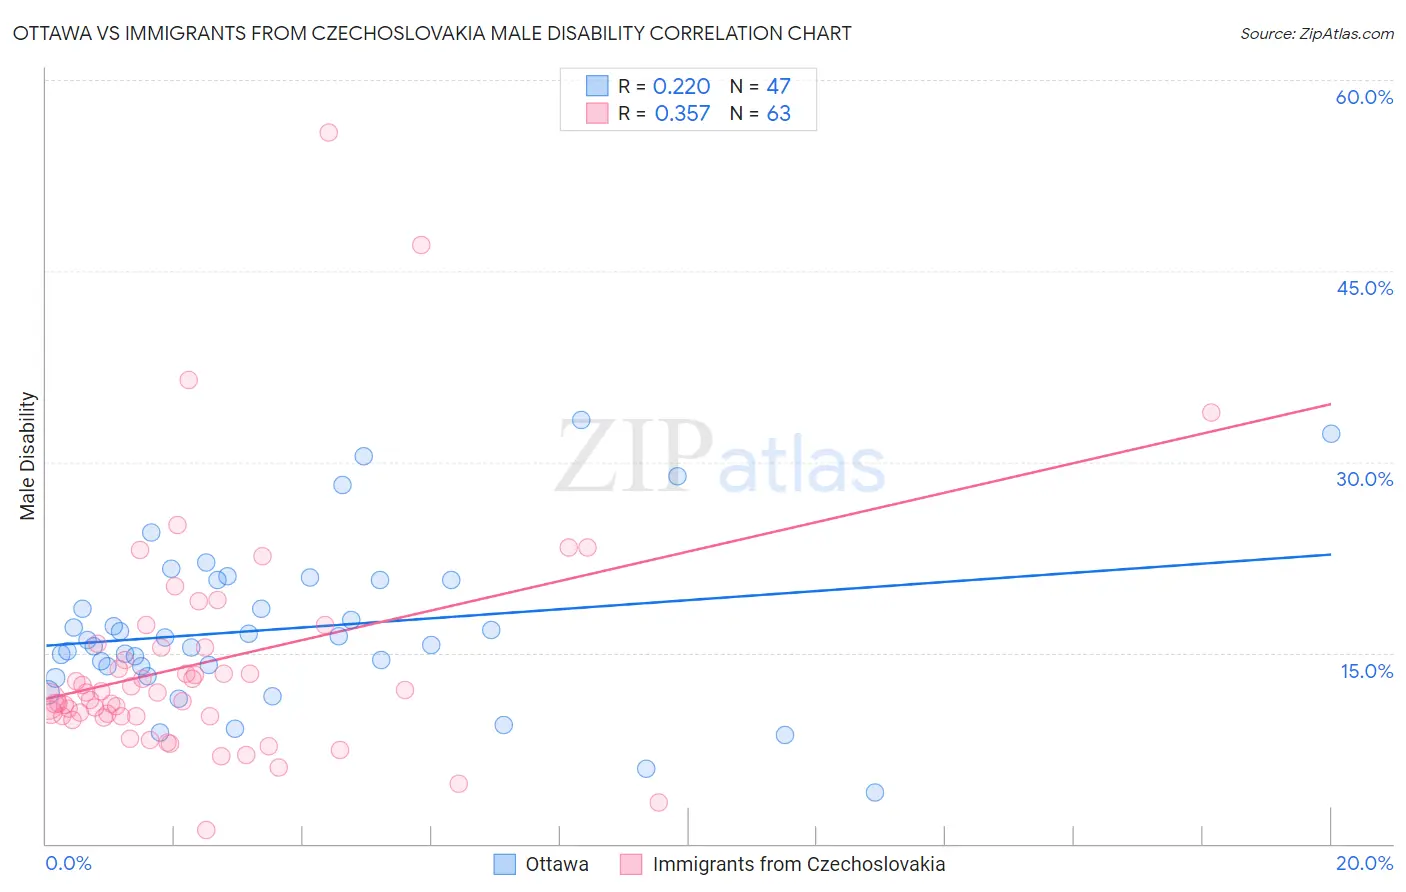
Ottawa vs Immigrants from Czechoslovakia Male Disability Correlation Chart
The statistical analysis conducted on geographies consisting of 49,955,365 people shows a weak positive correlation between the proportion of Ottawa and percentage of males with a disability in the United States with a correlation coefficient (R) of 0.220 and weighted average of 14.1%. Similarly, the statistical analysis conducted on geographies consisting of 195,455,879 people shows a mild positive correlation between the proportion of Immigrants from Czechoslovakia and percentage of males with a disability in the United States with a correlation coefficient (R) of 0.357 and weighted average of 10.9%, a difference of 29.1%.
Male Disability Correlation Summary
| Measurement | Ottawa | Immigrants from Czechoslovakia |
| Minimum | 4.1% | 1.1% |
| Maximum | 33.3% | 55.9% |
| Range | 29.3% | 54.9% |
| Mean | 16.9% | 14.3% |
| Median | 16.0% | 11.9% |
| Interquartile 25% (IQ1) | 13.9% | 10.0% |
| Interquartile 75% (IQ3) | 20.7% | 15.5% |
| Interquartile Range (IQR) | 6.8% | 5.4% |
| Standard Deviation (Sample) | 6.4% | 9.3% |
| Standard Deviation (Population) | 6.3% | 9.2% |
Similar Demographics by Male Disability
Demographics Similar to Ottawa by Male Disability
In terms of male disability, the demographic groups most similar to Ottawa are Comanche (14.1%, a difference of 0.11%), Osage (14.0%, a difference of 0.44%), Apache (14.0%, a difference of 0.51%), Native/Alaskan (14.2%, a difference of 0.94%), and Potawatomi (14.2%, a difference of 1.1%).
| Demographics | Rating | Rank | Male Disability |
| Cree | 0.0 /100 | #318 | Tragic 13.7% |
| Americans | 0.0 /100 | #319 | Tragic 13.8% |
| Tlingit-Haida | 0.0 /100 | #320 | Tragic 13.8% |
| Shoshone | 0.0 /100 | #321 | Tragic 13.8% |
| Apache | 0.0 /100 | #322 | Tragic 14.0% |
| Osage | 0.0 /100 | #323 | Tragic 14.0% |
| Comanche | 0.0 /100 | #324 | Tragic 14.1% |
| Ottawa | 0.0 /100 | #325 | Tragic 14.1% |
| Natives/Alaskans | 0.0 /100 | #326 | Tragic 14.2% |
| Potawatomi | 0.0 /100 | #327 | Tragic 14.2% |
| Chippewa | 0.0 /100 | #328 | Tragic 14.3% |
| Cajuns | 0.0 /100 | #329 | Tragic 14.4% |
| Navajo | 0.0 /100 | #330 | Tragic 14.4% |
| Tohono O'odham | 0.0 /100 | #331 | Tragic 14.6% |
| Seminole | 0.0 /100 | #332 | Tragic 14.7% |
Demographics Similar to Immigrants from Czechoslovakia by Male Disability
In terms of male disability, the demographic groups most similar to Immigrants from Czechoslovakia are South American Indian (10.9%, a difference of 0.040%), Immigrants from North Macedonia (10.9%, a difference of 0.040%), Immigrants from Ghana (10.9%, a difference of 0.090%), Immigrants from South Eastern Asia (10.9%, a difference of 0.11%), and Immigrants from Africa (10.9%, a difference of 0.15%).
| Demographics | Rating | Rank | Male Disability |
| Immigrants | South Africa | 91.8 /100 | #116 | Exceptional 10.8% |
| Eastern Europeans | 90.6 /100 | #117 | Exceptional 10.9% |
| Immigrants | Cuba | 90.2 /100 | #118 | Exceptional 10.9% |
| Armenians | 90.1 /100 | #119 | Exceptional 10.9% |
| Immigrants | Africa | 89.4 /100 | #120 | Excellent 10.9% |
| Immigrants | South Eastern Asia | 89.2 /100 | #121 | Excellent 10.9% |
| Immigrants | Ghana | 89.0 /100 | #122 | Excellent 10.9% |
| Immigrants | Czechoslovakia | 88.4 /100 | #123 | Excellent 10.9% |
| South American Indians | 88.1 /100 | #124 | Excellent 10.9% |
| Immigrants | North Macedonia | 88.1 /100 | #125 | Excellent 10.9% |
| Immigrants | Trinidad and Tobago | 86.9 /100 | #126 | Excellent 10.9% |
| Immigrants | Ukraine | 86.8 /100 | #127 | Excellent 10.9% |
| Immigrants | Latvia | 85.5 /100 | #128 | Excellent 10.9% |
| Immigrants | Philippines | 85.4 /100 | #129 | Excellent 10.9% |
| Brazilians | 85.4 /100 | #130 | Excellent 10.9% |