Ecuadorian vs Immigrants from Czechoslovakia Male Disability
COMPARE
Ecuadorian
Immigrants from Czechoslovakia
Male Disability
Male Disability Comparison
Ecuadorians
Immigrants from Czechoslovakia
10.5%
MALE DISABILITY
99.2/ 100
METRIC RATING
69th/ 347
METRIC RANK
10.9%
MALE DISABILITY
88.4/ 100
METRIC RATING
123rd/ 347
METRIC RANK
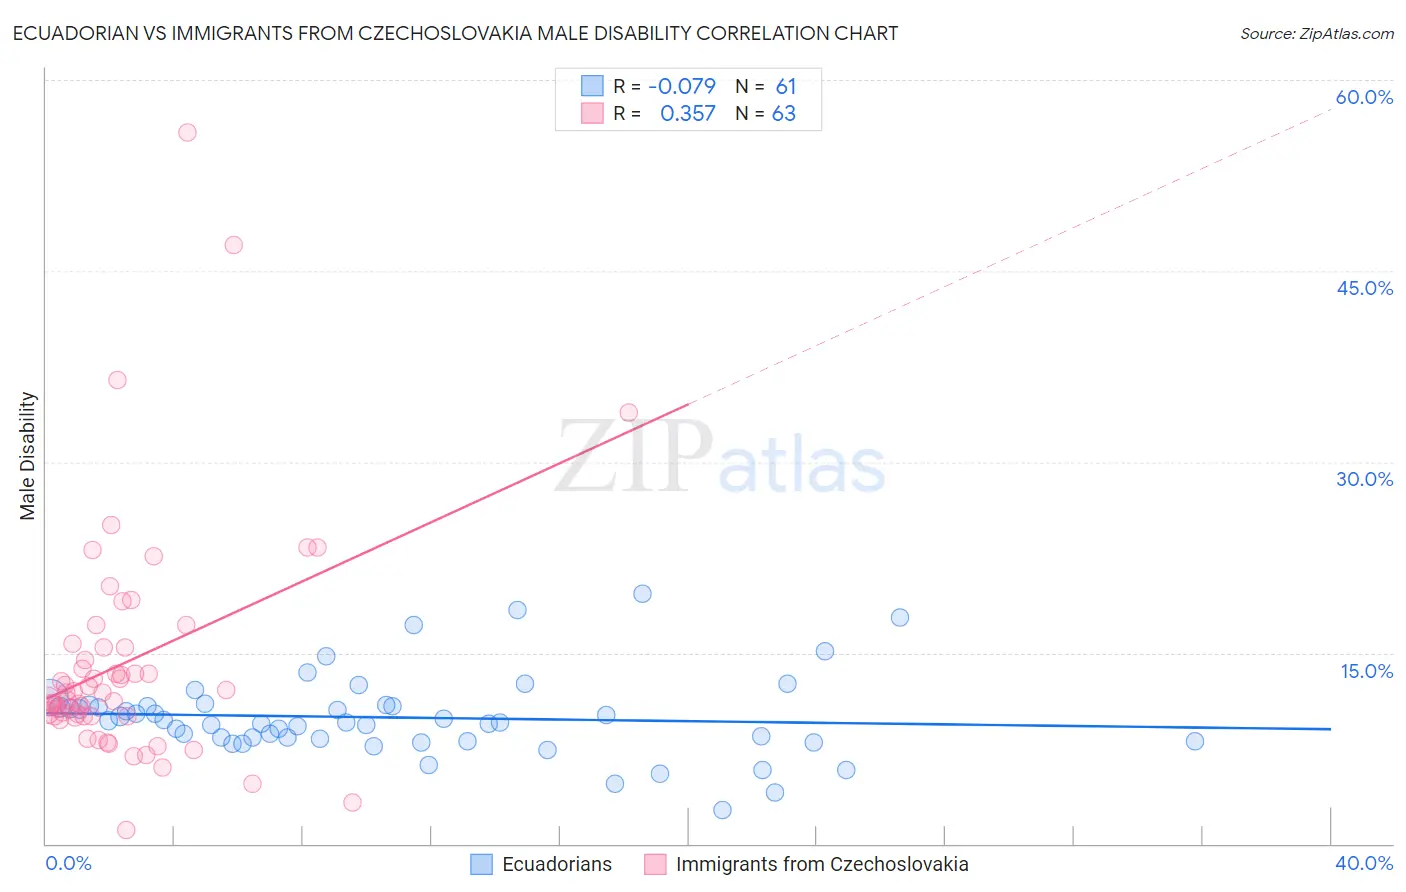
Ecuadorian vs Immigrants from Czechoslovakia Male Disability Correlation Chart
The statistical analysis conducted on geographies consisting of 317,801,764 people shows a slight negative correlation between the proportion of Ecuadorians and percentage of males with a disability in the United States with a correlation coefficient (R) of -0.079 and weighted average of 10.5%. Similarly, the statistical analysis conducted on geographies consisting of 195,455,879 people shows a mild positive correlation between the proportion of Immigrants from Czechoslovakia and percentage of males with a disability in the United States with a correlation coefficient (R) of 0.357 and weighted average of 10.9%, a difference of 4.1%.
Male Disability Correlation Summary
| Measurement | Ecuadorian | Immigrants from Czechoslovakia |
| Minimum | 2.6% | 1.1% |
| Maximum | 19.6% | 55.9% |
| Range | 17.0% | 54.9% |
| Mean | 9.9% | 14.3% |
| Median | 9.5% | 11.9% |
| Interquartile 25% (IQ1) | 8.2% | 10.0% |
| Interquartile 75% (IQ3) | 10.8% | 15.5% |
| Interquartile Range (IQR) | 2.7% | 5.4% |
| Standard Deviation (Sample) | 3.2% | 9.3% |
| Standard Deviation (Population) | 3.2% | 9.2% |
Similar Demographics by Male Disability
Demographics Similar to Ecuadorians by Male Disability
In terms of male disability, the demographic groups most similar to Ecuadorians are Colombian (10.5%, a difference of 0.0%), Immigrants from Afghanistan (10.5%, a difference of 0.10%), Immigrants from Grenada (10.5%, a difference of 0.11%), Guyanese (10.5%, a difference of 0.11%), and Jordanian (10.5%, a difference of 0.13%).
| Demographics | Rating | Rank | Male Disability |
| Immigrants | Ecuador | 99.3 /100 | #62 | Exceptional 10.4% |
| Immigrants | Belarus | 99.3 /100 | #63 | Exceptional 10.4% |
| Jordanians | 99.3 /100 | #64 | Exceptional 10.5% |
| Immigrants | Grenada | 99.2 /100 | #65 | Exceptional 10.5% |
| Guyanese | 99.2 /100 | #66 | Exceptional 10.5% |
| Immigrants | Afghanistan | 99.2 /100 | #67 | Exceptional 10.5% |
| Colombians | 99.2 /100 | #68 | Exceptional 10.5% |
| Ecuadorians | 99.2 /100 | #69 | Exceptional 10.5% |
| Immigrants | Bulgaria | 99.1 /100 | #70 | Exceptional 10.5% |
| Immigrants | Cameroon | 99.0 /100 | #71 | Exceptional 10.5% |
| Immigrants | Serbia | 99.0 /100 | #72 | Exceptional 10.5% |
| Immigrants | Lithuania | 98.9 /100 | #73 | Exceptional 10.5% |
| Immigrants | Lebanon | 98.8 /100 | #74 | Exceptional 10.5% |
| Sierra Leoneans | 98.7 /100 | #75 | Exceptional 10.5% |
| Immigrants | Sierra Leone | 98.7 /100 | #76 | Exceptional 10.5% |
Demographics Similar to Immigrants from Czechoslovakia by Male Disability
In terms of male disability, the demographic groups most similar to Immigrants from Czechoslovakia are South American Indian (10.9%, a difference of 0.040%), Immigrants from North Macedonia (10.9%, a difference of 0.040%), Immigrants from Ghana (10.9%, a difference of 0.090%), Immigrants from South Eastern Asia (10.9%, a difference of 0.11%), and Immigrants from Africa (10.9%, a difference of 0.15%).
| Demographics | Rating | Rank | Male Disability |
| Immigrants | South Africa | 91.8 /100 | #116 | Exceptional 10.8% |
| Eastern Europeans | 90.6 /100 | #117 | Exceptional 10.9% |
| Immigrants | Cuba | 90.2 /100 | #118 | Exceptional 10.9% |
| Armenians | 90.1 /100 | #119 | Exceptional 10.9% |
| Immigrants | Africa | 89.4 /100 | #120 | Excellent 10.9% |
| Immigrants | South Eastern Asia | 89.2 /100 | #121 | Excellent 10.9% |
| Immigrants | Ghana | 89.0 /100 | #122 | Excellent 10.9% |
| Immigrants | Czechoslovakia | 88.4 /100 | #123 | Excellent 10.9% |
| South American Indians | 88.1 /100 | #124 | Excellent 10.9% |
| Immigrants | North Macedonia | 88.1 /100 | #125 | Excellent 10.9% |
| Immigrants | Trinidad and Tobago | 86.9 /100 | #126 | Excellent 10.9% |
| Immigrants | Ukraine | 86.8 /100 | #127 | Excellent 10.9% |
| Immigrants | Latvia | 85.5 /100 | #128 | Excellent 10.9% |
| Immigrants | Philippines | 85.4 /100 | #129 | Excellent 10.9% |
| Brazilians | 85.4 /100 | #130 | Excellent 10.9% |