Vietnamese vs Immigrants from Czechoslovakia Male Disability
COMPARE
Vietnamese
Immigrants from Czechoslovakia
Male Disability
Male Disability Comparison
Vietnamese
Immigrants from Czechoslovakia
10.1%
MALE DISABILITY
99.9/ 100
METRIC RATING
28th/ 347
METRIC RANK
10.9%
MALE DISABILITY
88.4/ 100
METRIC RATING
123rd/ 347
METRIC RANK
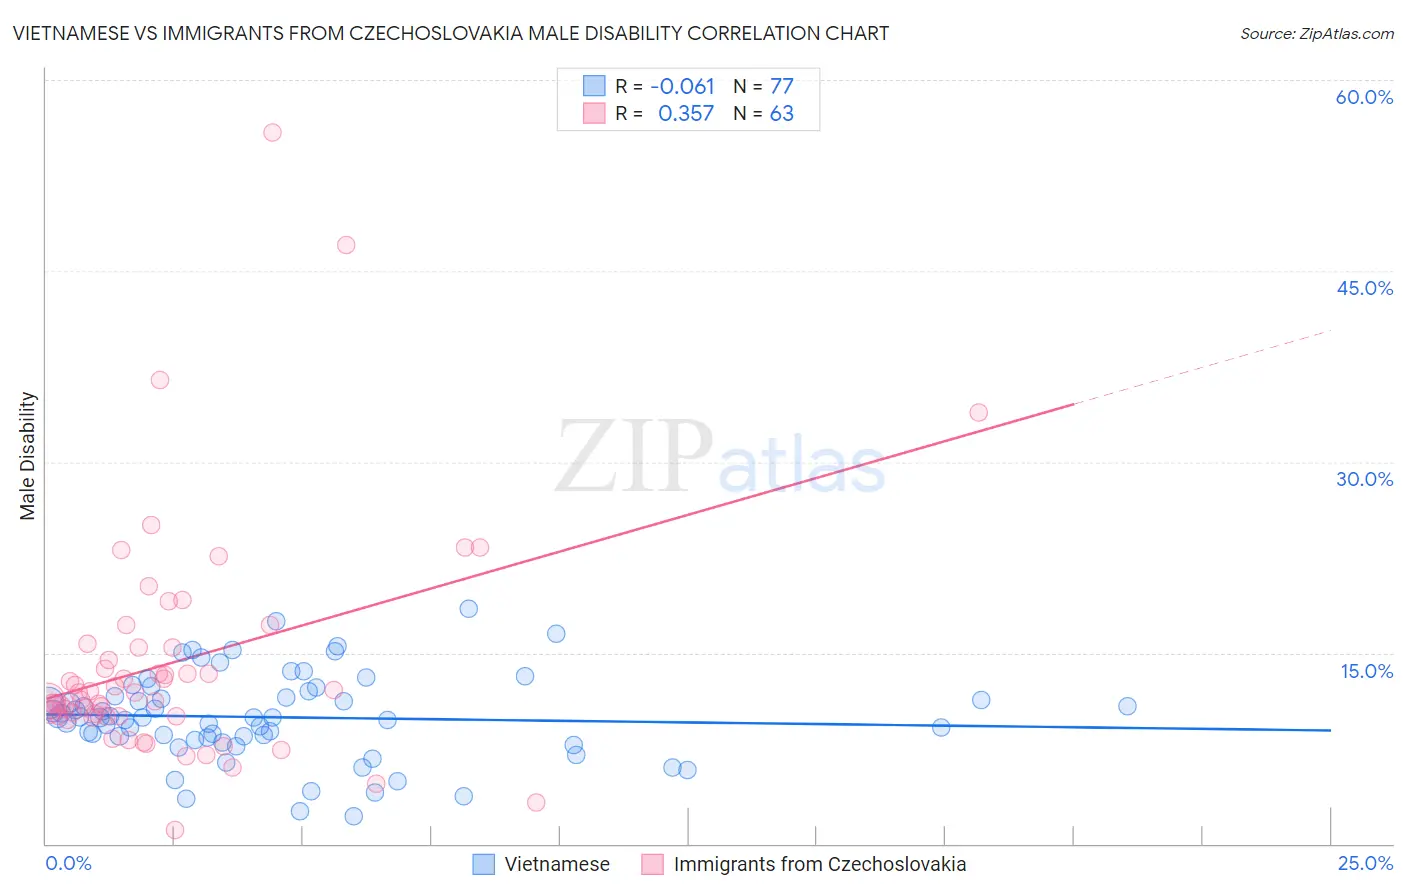
Vietnamese vs Immigrants from Czechoslovakia Male Disability Correlation Chart
The statistical analysis conducted on geographies consisting of 170,755,013 people shows a slight negative correlation between the proportion of Vietnamese and percentage of males with a disability in the United States with a correlation coefficient (R) of -0.061 and weighted average of 10.1%. Similarly, the statistical analysis conducted on geographies consisting of 195,455,879 people shows a mild positive correlation between the proportion of Immigrants from Czechoslovakia and percentage of males with a disability in the United States with a correlation coefficient (R) of 0.357 and weighted average of 10.9%, a difference of 8.0%.
Male Disability Correlation Summary
| Measurement | Vietnamese | Immigrants from Czechoslovakia |
| Minimum | 2.1% | 1.1% |
| Maximum | 18.4% | 55.9% |
| Range | 16.3% | 54.9% |
| Mean | 9.9% | 14.3% |
| Median | 9.9% | 11.9% |
| Interquartile 25% (IQ1) | 8.2% | 10.0% |
| Interquartile 75% (IQ3) | 11.8% | 15.5% |
| Interquartile Range (IQR) | 3.6% | 5.4% |
| Standard Deviation (Sample) | 3.4% | 9.3% |
| Standard Deviation (Population) | 3.4% | 9.2% |
Similar Demographics by Male Disability
Demographics Similar to Vietnamese by Male Disability
In terms of male disability, the demographic groups most similar to Vietnamese are Egyptian (10.1%, a difference of 0.020%), Venezuelan (10.1%, a difference of 0.15%), Immigrants from Egypt (10.1%, a difference of 0.19%), Soviet Union (10.1%, a difference of 0.26%), and Paraguayan (10.1%, a difference of 0.34%).
| Demographics | Rating | Rank | Male Disability |
| Burmese | 100.0 /100 | #21 | Exceptional 10.0% |
| Immigrants | Venezuela | 100.0 /100 | #22 | Exceptional 10.0% |
| Cypriots | 100.0 /100 | #23 | Exceptional 10.0% |
| Immigrants | Asia | 100.0 /100 | #24 | Exceptional 10.0% |
| Immigrants | Malaysia | 99.9 /100 | #25 | Exceptional 10.0% |
| Paraguayans | 99.9 /100 | #26 | Exceptional 10.1% |
| Egyptians | 99.9 /100 | #27 | Exceptional 10.1% |
| Vietnamese | 99.9 /100 | #28 | Exceptional 10.1% |
| Venezuelans | 99.9 /100 | #29 | Exceptional 10.1% |
| Immigrants | Egypt | 99.9 /100 | #30 | Exceptional 10.1% |
| Soviet Union | 99.9 /100 | #31 | Exceptional 10.1% |
| Argentineans | 99.9 /100 | #32 | Exceptional 10.1% |
| Immigrants | Ethiopia | 99.9 /100 | #33 | Exceptional 10.2% |
| Immigrants | Turkey | 99.9 /100 | #34 | Exceptional 10.2% |
| Immigrants | Argentina | 99.9 /100 | #35 | Exceptional 10.2% |
Demographics Similar to Immigrants from Czechoslovakia by Male Disability
In terms of male disability, the demographic groups most similar to Immigrants from Czechoslovakia are South American Indian (10.9%, a difference of 0.040%), Immigrants from North Macedonia (10.9%, a difference of 0.040%), Immigrants from Ghana (10.9%, a difference of 0.090%), Immigrants from South Eastern Asia (10.9%, a difference of 0.11%), and Immigrants from Africa (10.9%, a difference of 0.15%).
| Demographics | Rating | Rank | Male Disability |
| Immigrants | South Africa | 91.8 /100 | #116 | Exceptional 10.8% |
| Eastern Europeans | 90.6 /100 | #117 | Exceptional 10.9% |
| Immigrants | Cuba | 90.2 /100 | #118 | Exceptional 10.9% |
| Armenians | 90.1 /100 | #119 | Exceptional 10.9% |
| Immigrants | Africa | 89.4 /100 | #120 | Excellent 10.9% |
| Immigrants | South Eastern Asia | 89.2 /100 | #121 | Excellent 10.9% |
| Immigrants | Ghana | 89.0 /100 | #122 | Excellent 10.9% |
| Immigrants | Czechoslovakia | 88.4 /100 | #123 | Excellent 10.9% |
| South American Indians | 88.1 /100 | #124 | Excellent 10.9% |
| Immigrants | North Macedonia | 88.1 /100 | #125 | Excellent 10.9% |
| Immigrants | Trinidad and Tobago | 86.9 /100 | #126 | Excellent 10.9% |
| Immigrants | Ukraine | 86.8 /100 | #127 | Excellent 10.9% |
| Immigrants | Latvia | 85.5 /100 | #128 | Excellent 10.9% |
| Immigrants | Philippines | 85.4 /100 | #129 | Excellent 10.9% |
| Brazilians | 85.4 /100 | #130 | Excellent 10.9% |