African vs Immigrants from Czechoslovakia Male Disability
COMPARE
African
Immigrants from Czechoslovakia
Male Disability
Male Disability Comparison
Africans
Immigrants from Czechoslovakia
12.6%
MALE DISABILITY
0.0/ 100
METRIC RATING
276th/ 347
METRIC RANK
10.9%
MALE DISABILITY
88.4/ 100
METRIC RATING
123rd/ 347
METRIC RANK
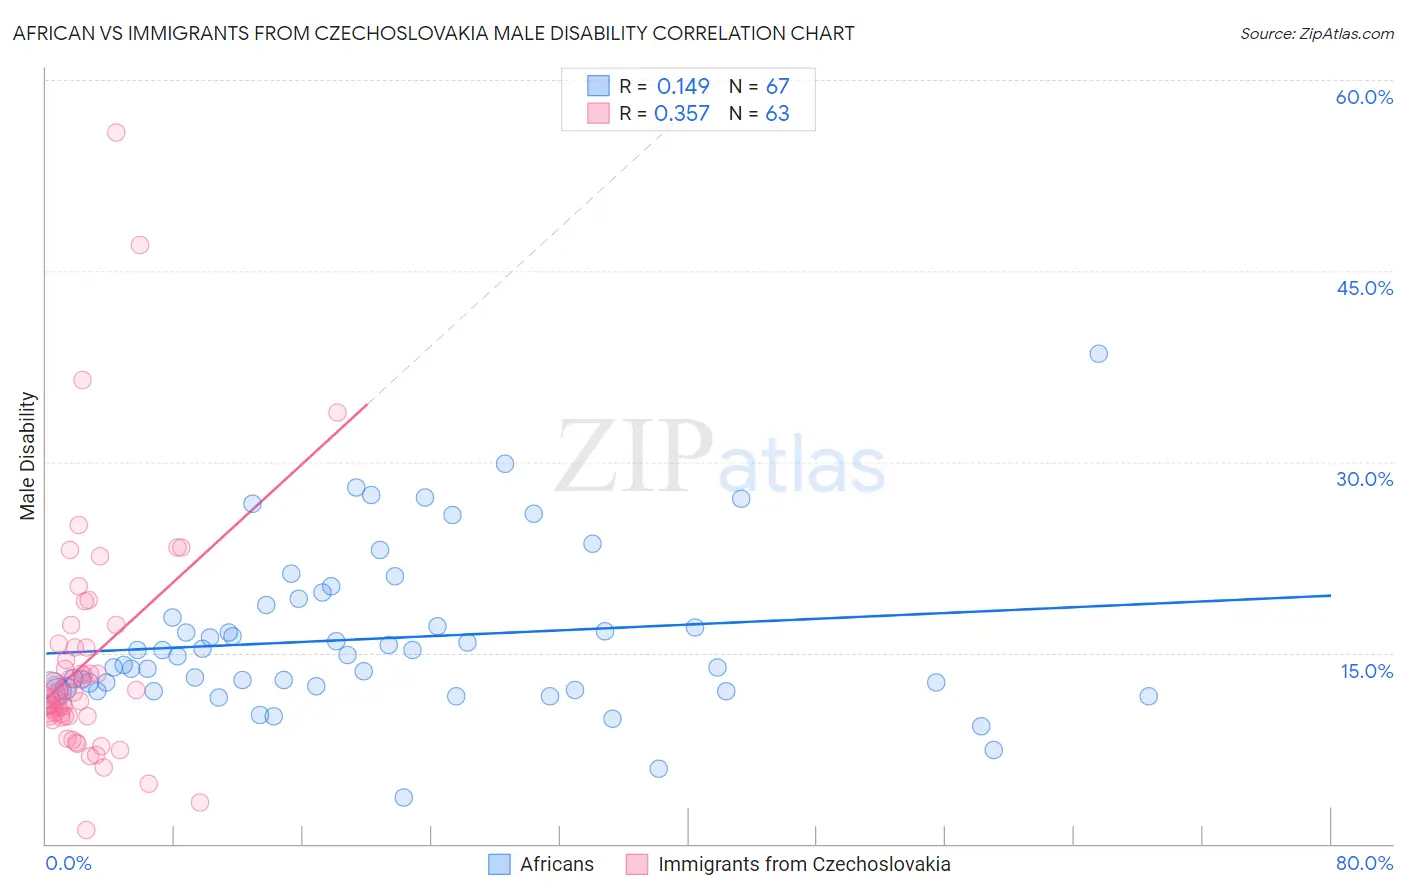
African vs Immigrants from Czechoslovakia Male Disability Correlation Chart
The statistical analysis conducted on geographies consisting of 469,942,383 people shows a poor positive correlation between the proportion of Africans and percentage of males with a disability in the United States with a correlation coefficient (R) of 0.149 and weighted average of 12.6%. Similarly, the statistical analysis conducted on geographies consisting of 195,455,879 people shows a mild positive correlation between the proportion of Immigrants from Czechoslovakia and percentage of males with a disability in the United States with a correlation coefficient (R) of 0.357 and weighted average of 10.9%, a difference of 15.3%.
Male Disability Correlation Summary
| Measurement | African | Immigrants from Czechoslovakia |
| Minimum | 3.6% | 1.1% |
| Maximum | 38.5% | 55.9% |
| Range | 34.8% | 54.9% |
| Mean | 16.1% | 14.3% |
| Median | 14.7% | 11.9% |
| Interquartile 25% (IQ1) | 12.1% | 10.0% |
| Interquartile 75% (IQ3) | 18.8% | 15.5% |
| Interquartile Range (IQR) | 6.7% | 5.4% |
| Standard Deviation (Sample) | 6.2% | 9.3% |
| Standard Deviation (Population) | 6.2% | 9.2% |
Similar Demographics by Male Disability
Demographics Similar to Africans by Male Disability
In terms of male disability, the demographic groups most similar to Africans are Fijian (12.6%, a difference of 0.050%), Finnish (12.6%, a difference of 0.31%), Hopi (12.5%, a difference of 0.40%), Native Hawaiian (12.5%, a difference of 0.74%), and Hmong (12.5%, a difference of 0.80%).
| Demographics | Rating | Rank | Male Disability |
| Czechoslovakians | 0.1 /100 | #269 | Tragic 12.3% |
| Spaniards | 0.1 /100 | #270 | Tragic 12.3% |
| Scandinavians | 0.1 /100 | #271 | Tragic 12.3% |
| Hmong | 0.0 /100 | #272 | Tragic 12.5% |
| Native Hawaiians | 0.0 /100 | #273 | Tragic 12.5% |
| Hopi | 0.0 /100 | #274 | Tragic 12.5% |
| Fijians | 0.0 /100 | #275 | Tragic 12.6% |
| Africans | 0.0 /100 | #276 | Tragic 12.6% |
| Finns | 0.0 /100 | #277 | Tragic 12.6% |
| Central American Indians | 0.0 /100 | #278 | Tragic 12.7% |
| Slovaks | 0.0 /100 | #279 | Tragic 12.7% |
| Dutch | 0.0 /100 | #280 | Tragic 12.7% |
| Sioux | 0.0 /100 | #281 | Tragic 12.7% |
| Irish | 0.0 /100 | #282 | Tragic 12.7% |
| Germans | 0.0 /100 | #283 | Tragic 12.7% |
Demographics Similar to Immigrants from Czechoslovakia by Male Disability
In terms of male disability, the demographic groups most similar to Immigrants from Czechoslovakia are South American Indian (10.9%, a difference of 0.040%), Immigrants from North Macedonia (10.9%, a difference of 0.040%), Immigrants from Ghana (10.9%, a difference of 0.090%), Immigrants from South Eastern Asia (10.9%, a difference of 0.11%), and Immigrants from Africa (10.9%, a difference of 0.15%).
| Demographics | Rating | Rank | Male Disability |
| Immigrants | South Africa | 91.8 /100 | #116 | Exceptional 10.8% |
| Eastern Europeans | 90.6 /100 | #117 | Exceptional 10.9% |
| Immigrants | Cuba | 90.2 /100 | #118 | Exceptional 10.9% |
| Armenians | 90.1 /100 | #119 | Exceptional 10.9% |
| Immigrants | Africa | 89.4 /100 | #120 | Excellent 10.9% |
| Immigrants | South Eastern Asia | 89.2 /100 | #121 | Excellent 10.9% |
| Immigrants | Ghana | 89.0 /100 | #122 | Excellent 10.9% |
| Immigrants | Czechoslovakia | 88.4 /100 | #123 | Excellent 10.9% |
| South American Indians | 88.1 /100 | #124 | Excellent 10.9% |
| Immigrants | North Macedonia | 88.1 /100 | #125 | Excellent 10.9% |
| Immigrants | Trinidad and Tobago | 86.9 /100 | #126 | Excellent 10.9% |
| Immigrants | Ukraine | 86.8 /100 | #127 | Excellent 10.9% |
| Immigrants | Latvia | 85.5 /100 | #128 | Excellent 10.9% |
| Immigrants | Philippines | 85.4 /100 | #129 | Excellent 10.9% |
| Brazilians | 85.4 /100 | #130 | Excellent 10.9% |