Slovene vs Immigrants from Guyana Disability Age 5 to 17

COMPARE

Slovene
Race
Ancestry
AfghanAfricanAlaska NativeAlaskan AthabascanAlbanianAleutAlsatianAmericanApacheArabArapahoArgentineanArmenianAssyrian/Chaldean/SyriacAustralianAustrianBahamianBangladeshiBarbadianBasqueBelgianBelizeanBermudanBhutaneseBlackfeetBolivianBrazilianBritishBritish West IndianBulgarianBurmeseCajunCambodianCanadianCape VerdeanCarpatho RusynCelticCentral AmericanCentral American IndianCherokeeCheyenneChickasawChileanChineseChippewaChoctawColombianColvilleComancheCosta RicanCreeCreekCroatianCrowCubanCypriotCzechCzechoslovakianDanishDelawareDominicanDutchDutch West IndianEastern EuropeanEcuadorianEgyptianEnglishEstonianEthiopianEuropeanFijianFilipinoFinnishFrenchFrench American IndianFrench CanadianGermanGerman RussianGhanaianGreekGuamanian/ChamorroGuatemalanGuyaneseHaitianHmongHonduranHopiHoumaHungarianIcelanderIndian (Asian)IndonesianInupiatIranianIraqiIrishIroquoisIsraeliItalianJamaicanJapaneseJordanianKenyanKiowaKoreanLaotianLatvianLebaneseLiberianLithuanianLumbeeLuxembourgerMacedonianMalaysianMalteseMarshalleseMenomineeMexicanMexican American IndianMongolianMoroccanNative HawaiianNavajoNepaleseNew ZealanderNicaraguanNigerianNorthern EuropeanNorwegianOkinawanOsageOttawaPaiutePakistaniPalestinianPanamanianParaguayanPennsylvania GermanPeruvianPimaPolishPortuguesePotawatomiPuebloPuerto RicanPuget Sound SalishRomanianRussianSalvadoranSamoanScandinavianScotch-IrishScottishSeminoleSenegaleseSerbianShoshoneSierra LeoneanSiouxSlavicSlovakSloveneSomaliSouth AfricanSouth AmericanSouth American IndianSoviet UnionSpaniardSpanishSpanish AmericanSpanish American IndianSri LankanSubsaharan AfricanSudaneseSwedishSwissSyrianTaiwaneseThaiTlingit-HaidaTohono O'OdhamTonganTrinidadian and TobagonianTsimshianTurkishU.S. Virgin IslanderUgandanUkrainianUruguayanUteVenezuelanVietnameseWelshWest IndianYakamaYaquiYugoslavianYumanYup'ikZimbabwean
Immigration
NonimmigrantsImmigrantsAfghanistanAfricaAlbaniaArgentinaArmeniaAsiaAustraliaAustriaBahamasBangladeshBarbadosBelarusBelgiumBelizeBoliviaBosnia and HerzegovinaBrazilBulgariaBurma/MyanmarCabo VerdeCambodiaCameroonCanadaCaribbeanCentral AmericaChileChinaColombiaCongoCosta RicaCroatiaCubaCzechoslovakiaDenmarkDominicaDominican RepublicEastern AfricaEastern AsiaEastern EuropeEcuadorEgyptEl SalvadorEnglandEritreaEthiopiaEuropeFijiFranceGermanyGhanaGreeceGrenadaGuatemalaHaitiHondurasHong KongHungaryIndiaIndonesiaIranIraqIrelandIsraelItalyJamaicaJapanJordanKazakhstanKenyaKoreaKuwaitLaosLatin AmericaLatviaLebanonLiberiaLithuaniaMalaysiaMexicoMicronesiaMiddle AfricaMoldovaMoroccoNepalNetherlandsNicaraguaNigeriaNorth AmericaNorth MacedoniaNorthern AfricaNorthern EuropeNorwayOceaniaPakistanPanamaPeruPhilippinesPolandPortugalRomaniaRussiaSaudi ArabiaScotlandSenegalSerbiaSierra LeoneSingaporeSomaliaSouth AfricaSouth AmericaSouth Central AsiaSouth Eastern AsiaSouthern EuropeSpainSri LankaSt. Vincent and the GrenadinesSudanSwedenSwitzerlandSyriaTaiwanThailandTrinidad and TobagoTurkeyUgandaUkraineUruguayUzbekistanVenezuelaVietnamWest IndiesWestern AfricaWestern AsiaWestern EuropeYemenZaireZimbabweAzores
Immigrants from Guyana
Race
Ancestry
AfghanAfricanAlaska NativeAlaskan AthabascanAlbanianAleutAlsatianAmericanApacheArabArapahoArgentineanArmenianAssyrian/Chaldean/SyriacAustralianAustrianBahamianBangladeshiBarbadianBasqueBelgianBelizeanBermudanBhutaneseBlackfeetBolivianBrazilianBritishBritish West IndianBulgarianBurmeseCajunCambodianCanadianCape VerdeanCarpatho RusynCelticCentral AmericanCentral American IndianCherokeeCheyenneChickasawChileanChineseChippewaChoctawColombianColvilleComancheCosta RicanCreeCreekCroatianCrowCubanCypriotCzechCzechoslovakianDanishDelawareDominicanDutchDutch West IndianEastern EuropeanEcuadorianEgyptianEnglishEstonianEthiopianEuropeanFijianFilipinoFinnishFrenchFrench American IndianFrench CanadianGermanGerman RussianGhanaianGreekGuamanian/ChamorroGuatemalanGuyaneseHaitianHmongHonduranHopiHoumaHungarianIcelanderIndian (Asian)IndonesianInupiatIranianIraqiIrishIroquoisIsraeliItalianJamaicanJapaneseJordanianKenyanKiowaKoreanLaotianLatvianLebaneseLiberianLithuanianLumbeeLuxembourgerMacedonianMalaysianMalteseMarshalleseMenomineeMexicanMexican American IndianMongolianMoroccanNative HawaiianNavajoNepaleseNew ZealanderNicaraguanNigerianNorthern EuropeanNorwegianOkinawanOsageOttawaPaiutePakistaniPalestinianPanamanianParaguayanPennsylvania GermanPeruvianPimaPolishPortuguesePotawatomiPuebloPuerto RicanPuget Sound SalishRomanianRussianSalvadoranSamoanScandinavianScotch-IrishScottishSeminoleSenegaleseSerbianShoshoneSierra LeoneanSiouxSlavicSlovakSomaliSouth AfricanSouth AmericanSouth American IndianSoviet UnionSpaniardSpanishSpanish AmericanSpanish American IndianSri LankanSubsaharan AfricanSudaneseSwedishSwissSyrianTaiwaneseThaiTlingit-HaidaTohono O'OdhamTonganTrinidadian and TobagonianTsimshianTurkishU.S. Virgin IslanderUgandanUkrainianUruguayanUteVenezuelanVietnameseWelshWest IndianYakamaYaquiYugoslavianYumanYup'ikZimbabwean
Immigration
NonimmigrantsImmigrantsAfghanistanAfricaAlbaniaArgentinaArmeniaAsiaAustraliaAustriaBahamasBangladeshBarbadosBelarusBelgiumBelizeBoliviaBosnia and HerzegovinaBrazilBulgariaBurma/MyanmarCabo VerdeCambodiaCameroonCanadaCaribbeanCentral AmericaChileChinaColombiaCongoCosta RicaCroatiaCubaCzechoslovakiaDenmarkDominicaDominican RepublicEastern AfricaEastern AsiaEastern EuropeEcuadorEgyptEl SalvadorEnglandEritreaEthiopiaEuropeFijiFranceGermanyGhanaGreeceGrenadaGuatemalaGuyanaHaitiHondurasHong KongHungaryIndiaIndonesiaIranIraqIrelandIsraelItalyJamaicaJapanJordanKazakhstanKenyaKoreaKuwaitLaosLatin AmericaLatviaLebanonLiberiaLithuaniaMalaysiaMexicoMicronesiaMiddle AfricaMoldovaMoroccoNepalNetherlandsNicaraguaNigeriaNorth AmericaNorth MacedoniaNorthern AfricaNorthern EuropeNorwayOceaniaPakistanPanamaPeruPhilippinesPolandPortugalRomaniaRussiaSaudi ArabiaScotlandSenegalSerbiaSierra LeoneSingaporeSomaliaSouth AfricaSouth AmericaSouth Central AsiaSouth Eastern AsiaSouthern EuropeSpainSri LankaSt. Vincent and the GrenadinesSudanSwedenSwitzerlandSyriaTaiwanThailandTrinidad and TobagoTurkeyUgandaUkraineUruguayUzbekistanVenezuelaVietnamWest IndiesWestern AfricaWestern AsiaWestern EuropeYemenZaireZimbabweAzores
Disability Age 5 to 17
Income
Poverty
Unemployment
Labor Participation
Family Structure
Vehicle Availability
Education Level
Disability

Disability Age 5 to 17 Comparison

Slovenes

Immigrants from Guyana

Tragic
Exceptional
6.0%
DISABILITY AGE 5 TO 17
0.6/ 100
METRIC RATING
266th/ 347
METRIC RANK
5.2%
DISABILITY AGE 5 TO 17
99.6/ 100
METRIC RATING
76th/ 347
METRIC RANK

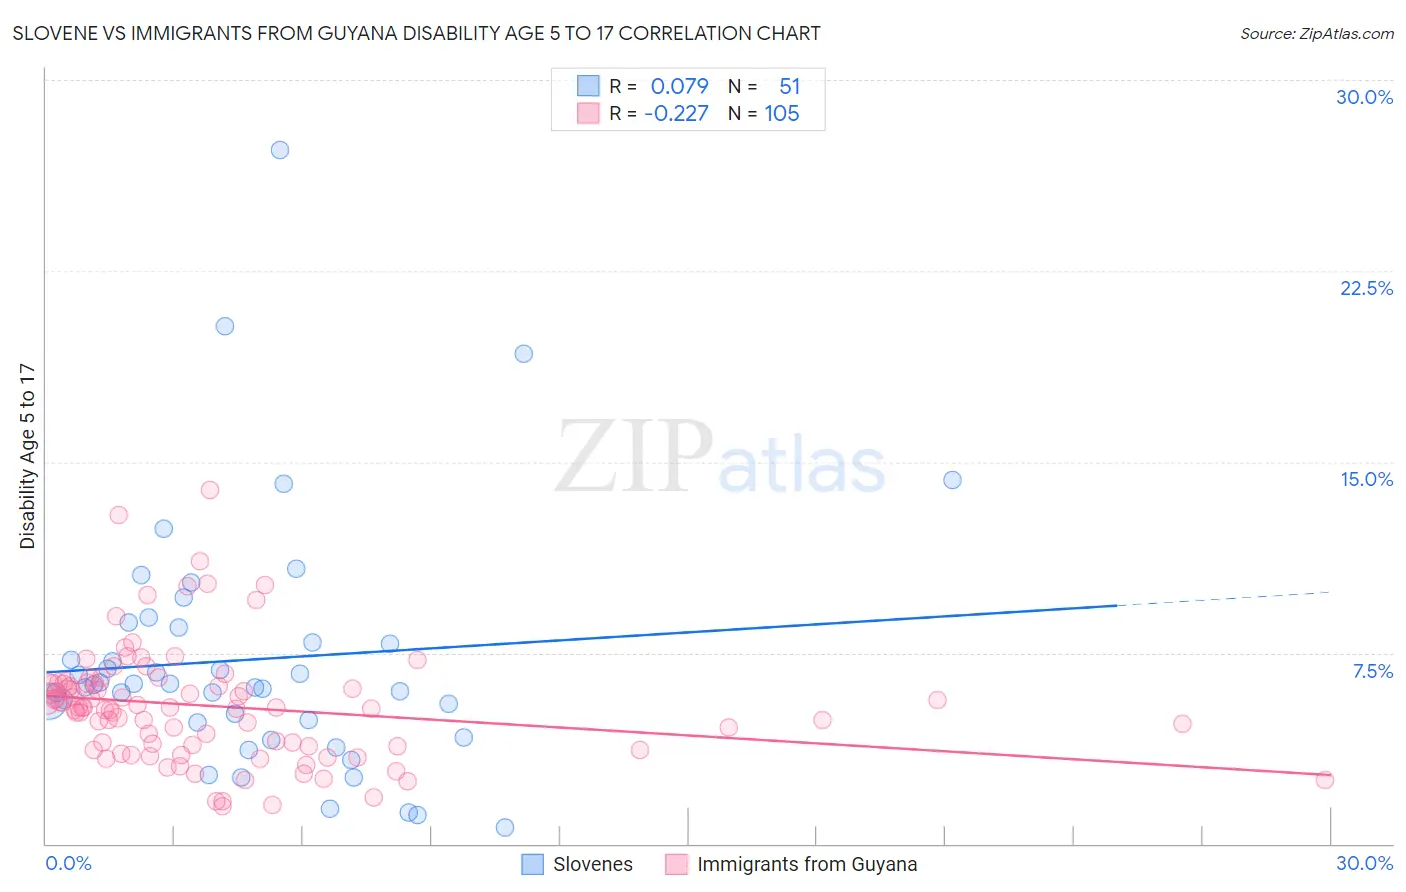
Slovene vs Immigrants from Guyana Disability Age 5 to 17 Correlation Chart

The statistical analysis conducted on geographies consisting of 259,532,016 people shows a slight positive correlation between the proportion of Slovenes and percentage of population with a disability between the ages 5 and 17 in the United States with a correlation coefficient (R) of 0.079 and weighted average of 6.0%. Similarly, the statistical analysis conducted on geographies consisting of 183,069,872 people shows a weak negative correlation between the proportion of Immigrants from Guyana and percentage of population with a disability between the ages 5 and 17 in the United States with a correlation coefficient (R) of -0.227 and weighted average of 5.2%, a difference of 14.2%.
Slovene vs Immigrants from Guyana Disability Age 5 to 17

Disability Age 5 to 17 Correlation Summary

MeasurementSloveneImmigrants from Guyana
Minimum0.63%1.5%
Maximum27.3%13.9%
Range26.6%12.4%
Mean7.2%5.4%
Median6.2%5.3%
Interquartile 25% (IQ1)4.8%3.8%
Interquartile 75% (IQ3)8.5%6.3%
Interquartile Range (IQR)3.7%2.5%
Standard Deviation (Sample)4.9%2.3%
Standard Deviation (Population)4.9%2.2%

Similar Demographics by Disability Age 5 to 17

Demographics Similar to Slovenes by Disability Age 5 to 17

In terms of disability age 5 to 17, the demographic groups most similar to Slovenes are Panamanian (6.0%, a difference of 0.030%), Canadian (6.0%, a difference of 0.10%), Spanish (6.0%, a difference of 0.11%), Czechoslovakian (5.9%, a difference of 0.22%), and Immigrants from Western Africa (5.9%, a difference of 0.30%).
DemographicsRating | RankDisability Age 5 to 17
Slavs
0.9
/100
|
#259
Tragic
5.9%
Somalis
0.8
/100
|
#260
Tragic
5.9%
Immigrants | Middle Africa
0.7
/100
|
#261
Tragic
5.9%
Immigrants | Western Africa
0.7
/100
|
#262
Tragic
5.9%
Czechoslovakians
0.7
/100
|
#263
Tragic
5.9%
Canadians
0.6
/100
|
#264
Tragic
6.0%
Panamanians
0.6
/100
|
#265
Tragic
6.0%
Slovenes
0.6
/100
|
#266
Tragic
6.0%
Spanish
0.5
/100
|
#267
Tragic
6.0%
Sioux
0.4
/100
|
#268
Tragic
6.0%
Liberians
0.4
/100
|
#269
Tragic
6.0%
Immigrants | Somalia
0.4
/100
|
#270
Tragic
6.0%
Immigrants | Zaire
0.2
/100
|
#271
Tragic
6.0%
Finns
0.2
/100
|
#272
Tragic
6.0%
Alaska Natives
0.2
/100
|
#273
Tragic
6.0%

Demographics Similar to Immigrants from Guyana by Disability Age 5 to 17

In terms of disability age 5 to 17, the demographic groups most similar to Immigrants from Guyana are Immigrants from Kazakhstan (5.2%, a difference of 0.030%), Immigrants from Moldova (5.2%, a difference of 0.040%), Immigrants from Cuba (5.2%, a difference of 0.040%), Afghan (5.2%, a difference of 0.070%), and Sri Lankan (5.2%, a difference of 0.10%).
DemographicsRating | RankDisability Age 5 to 17
Guyanese
99.7
/100
|
#69
Exceptional
5.2%
Immigrants | Belgium
99.7
/100
|
#70
Exceptional
5.2%
Jordanians
99.7
/100
|
#71
Exceptional
5.2%
Immigrants | Vietnam
99.7
/100
|
#72
Exceptional
5.2%
Immigrants | Czechoslovakia
99.7
/100
|
#73
Exceptional
5.2%
Immigrants | Romania
99.7
/100
|
#74
Exceptional
5.2%
Immigrants | Moldova
99.6
/100
|
#75
Exceptional
5.2%
Immigrants | Guyana
99.6
/100
|
#76
Exceptional
5.2%
Immigrants | Kazakhstan
99.6
/100
|
#77
Exceptional
5.2%
Immigrants | Cuba
99.6
/100
|
#78
Exceptional
5.2%
Afghans
99.6
/100
|
#79
Exceptional
5.2%
Sri Lankans
99.6
/100
|
#80
Exceptional
5.2%
Native Hawaiians
99.6
/100
|
#81
Exceptional
5.2%
Immigrants | Sweden
99.5
/100
|
#82
Exceptional
5.2%
Immigrants | France
99.5
/100
|
#83
Exceptional
5.2%