Pennsylvania German vs Immigrants from Guyana Unemployment Among Ages 30 to 34 years

COMPARE

Pennsylvania German
Race
Ancestry
AfghanAfricanAlaska NativeAlaskan AthabascanAlbanianAleutAlsatianAmericanApacheArabArapahoArgentineanArmenianAssyrian/Chaldean/SyriacAustralianAustrianBahamianBangladeshiBarbadianBasqueBelgianBelizeanBermudanBhutaneseBlackfeetBolivianBrazilianBritishBritish West IndianBulgarianBurmeseCajunCambodianCanadianCape VerdeanCarpatho RusynCelticCentral AmericanCentral American IndianCherokeeCheyenneChickasawChileanChineseChippewaChoctawColombianColvilleComancheCosta RicanCreeCreekCroatianCrowCubanCypriotCzechCzechoslovakianDanishDelawareDominicanDutchDutch West IndianEastern EuropeanEcuadorianEgyptianEnglishEstonianEthiopianEuropeanFijianFilipinoFinnishFrenchFrench American IndianFrench CanadianGermanGerman RussianGhanaianGreekGuamanian/ChamorroGuatemalanGuyaneseHaitianHmongHonduranHopiHoumaHungarianIcelanderIndian (Asian)IndonesianInupiatIranianIraqiIrishIroquoisIsraeliItalianJamaicanJapaneseJordanianKenyanKiowaKoreanLaotianLatvianLebaneseLiberianLithuanianLumbeeLuxembourgerMacedonianMalaysianMalteseMarshalleseMenomineeMexicanMexican American IndianMongolianMoroccanNative HawaiianNavajoNepaleseNew ZealanderNicaraguanNigerianNorthern EuropeanNorwegianOkinawanOsageOttawaPaiutePakistaniPalestinianPanamanianParaguayanPennsylvania GermanPeruvianPimaPolishPortuguesePotawatomiPuebloPuerto RicanPuget Sound SalishRomanianRussianSalvadoranSamoanScandinavianScotch-IrishScottishSeminoleSenegaleseSerbianShoshoneSierra LeoneanSiouxSlavicSlovakSloveneSomaliSouth AfricanSouth AmericanSouth American IndianSoviet UnionSpaniardSpanishSpanish AmericanSpanish American IndianSri LankanSubsaharan AfricanSudaneseSwedishSwissSyrianTaiwaneseThaiTlingit-HaidaTohono O'OdhamTonganTrinidadian and TobagonianTsimshianTurkishU.S. Virgin IslanderUgandanUkrainianUruguayanUteVenezuelanVietnameseWelshWest IndianYakamaYaquiYugoslavianYumanYup'ikZimbabwean
Immigration
NonimmigrantsImmigrantsAfghanistanAfricaAlbaniaArgentinaArmeniaAsiaAustraliaAustriaBahamasBangladeshBarbadosBelarusBelgiumBelizeBoliviaBosnia and HerzegovinaBrazilBulgariaBurma/MyanmarCabo VerdeCambodiaCameroonCanadaCaribbeanCentral AmericaChileChinaColombiaCongoCosta RicaCroatiaCubaCzechoslovakiaDenmarkDominicaDominican RepublicEastern AfricaEastern AsiaEastern EuropeEcuadorEgyptEl SalvadorEnglandEritreaEthiopiaEuropeFijiFranceGermanyGhanaGreeceGrenadaGuatemalaHaitiHondurasHong KongHungaryIndiaIndonesiaIranIraqIrelandIsraelItalyJamaicaJapanJordanKazakhstanKenyaKoreaKuwaitLaosLatin AmericaLatviaLebanonLiberiaLithuaniaMalaysiaMexicoMicronesiaMiddle AfricaMoldovaMoroccoNepalNetherlandsNicaraguaNigeriaNorth AmericaNorth MacedoniaNorthern AfricaNorthern EuropeNorwayOceaniaPakistanPanamaPeruPhilippinesPolandPortugalRomaniaRussiaSaudi ArabiaScotlandSenegalSerbiaSierra LeoneSingaporeSomaliaSouth AfricaSouth AmericaSouth Central AsiaSouth Eastern AsiaSouthern EuropeSpainSri LankaSt. Vincent and the GrenadinesSudanSwedenSwitzerlandSyriaTaiwanThailandTrinidad and TobagoTurkeyUgandaUkraineUruguayUzbekistanVenezuelaVietnamWest IndiesWestern AfricaWestern AsiaWestern EuropeYemenZaireZimbabweAzores
Immigrants from Guyana
Race
Ancestry
AfghanAfricanAlaska NativeAlaskan AthabascanAlbanianAleutAlsatianAmericanApacheArabArapahoArgentineanArmenianAssyrian/Chaldean/SyriacAustralianAustrianBahamianBangladeshiBarbadianBasqueBelgianBelizeanBermudanBhutaneseBlackfeetBolivianBrazilianBritishBritish West IndianBulgarianBurmeseCajunCambodianCanadianCape VerdeanCarpatho RusynCelticCentral AmericanCentral American IndianCherokeeCheyenneChickasawChileanChineseChippewaChoctawColombianColvilleComancheCosta RicanCreeCreekCroatianCrowCubanCypriotCzechCzechoslovakianDanishDelawareDominicanDutchDutch West IndianEastern EuropeanEcuadorianEgyptianEnglishEstonianEthiopianEuropeanFijianFilipinoFinnishFrenchFrench American IndianFrench CanadianGermanGerman RussianGhanaianGreekGuamanian/ChamorroGuatemalanGuyaneseHaitianHmongHonduranHopiHoumaHungarianIcelanderIndian (Asian)IndonesianInupiatIranianIraqiIrishIroquoisIsraeliItalianJamaicanJapaneseJordanianKenyanKiowaKoreanLaotianLatvianLebaneseLiberianLithuanianLumbeeLuxembourgerMacedonianMalaysianMalteseMarshalleseMenomineeMexicanMexican American IndianMongolianMoroccanNative HawaiianNavajoNepaleseNew ZealanderNicaraguanNigerianNorthern EuropeanNorwegianOkinawanOsageOttawaPaiutePakistaniPalestinianPanamanianParaguayanPeruvianPimaPolishPortuguesePotawatomiPuebloPuerto RicanPuget Sound SalishRomanianRussianSalvadoranSamoanScandinavianScotch-IrishScottishSeminoleSenegaleseSerbianShoshoneSierra LeoneanSiouxSlavicSlovakSloveneSomaliSouth AfricanSouth AmericanSouth American IndianSoviet UnionSpaniardSpanishSpanish AmericanSpanish American IndianSri LankanSubsaharan AfricanSudaneseSwedishSwissSyrianTaiwaneseThaiTlingit-HaidaTohono O'OdhamTonganTrinidadian and TobagonianTsimshianTurkishU.S. Virgin IslanderUgandanUkrainianUruguayanUteVenezuelanVietnameseWelshWest IndianYakamaYaquiYugoslavianYumanYup'ikZimbabwean
Immigration
NonimmigrantsImmigrantsAfghanistanAfricaAlbaniaArgentinaArmeniaAsiaAustraliaAustriaBahamasBangladeshBarbadosBelarusBelgiumBelizeBoliviaBosnia and HerzegovinaBrazilBulgariaBurma/MyanmarCabo VerdeCambodiaCameroonCanadaCaribbeanCentral AmericaChileChinaColombiaCongoCosta RicaCroatiaCubaCzechoslovakiaDenmarkDominicaDominican RepublicEastern AfricaEastern AsiaEastern EuropeEcuadorEgyptEl SalvadorEnglandEritreaEthiopiaEuropeFijiFranceGermanyGhanaGreeceGrenadaGuatemalaGuyanaHaitiHondurasHong KongHungaryIndiaIndonesiaIranIraqIrelandIsraelItalyJamaicaJapanJordanKazakhstanKenyaKoreaKuwaitLaosLatin AmericaLatviaLebanonLiberiaLithuaniaMalaysiaMexicoMicronesiaMiddle AfricaMoldovaMoroccoNepalNetherlandsNicaraguaNigeriaNorth AmericaNorth MacedoniaNorthern AfricaNorthern EuropeNorwayOceaniaPakistanPanamaPeruPhilippinesPolandPortugalRomaniaRussiaSaudi ArabiaScotlandSenegalSerbiaSierra LeoneSingaporeSomaliaSouth AfricaSouth AmericaSouth Central AsiaSouth Eastern AsiaSouthern EuropeSpainSri LankaSt. Vincent and the GrenadinesSudanSwedenSwitzerlandSyriaTaiwanThailandTrinidad and TobagoTurkeyUgandaUkraineUruguayUzbekistanVenezuelaVietnamWest IndiesWestern AfricaWestern AsiaWestern EuropeYemenZaireZimbabweAzores
Unemployment Among Ages 30 to 34 years
Income
Poverty
Unemployment
Labor Participation
Family Structure
Vehicle Availability
Education Level
Disability

Unemployment Among Ages 30 to 34 years Comparison

Pennsylvania Germans

Immigrants from Guyana

Tragic
Tragic
6.3%
UNEMPLOYMENT AMONG AGES 30 TO 34 YEARS
0.0/ 100
METRIC RATING
276th/ 347
METRIC RANK
7.2%
UNEMPLOYMENT AMONG AGES 30 TO 34 YEARS
0.0/ 100
METRIC RATING
321st/ 347
METRIC RANK

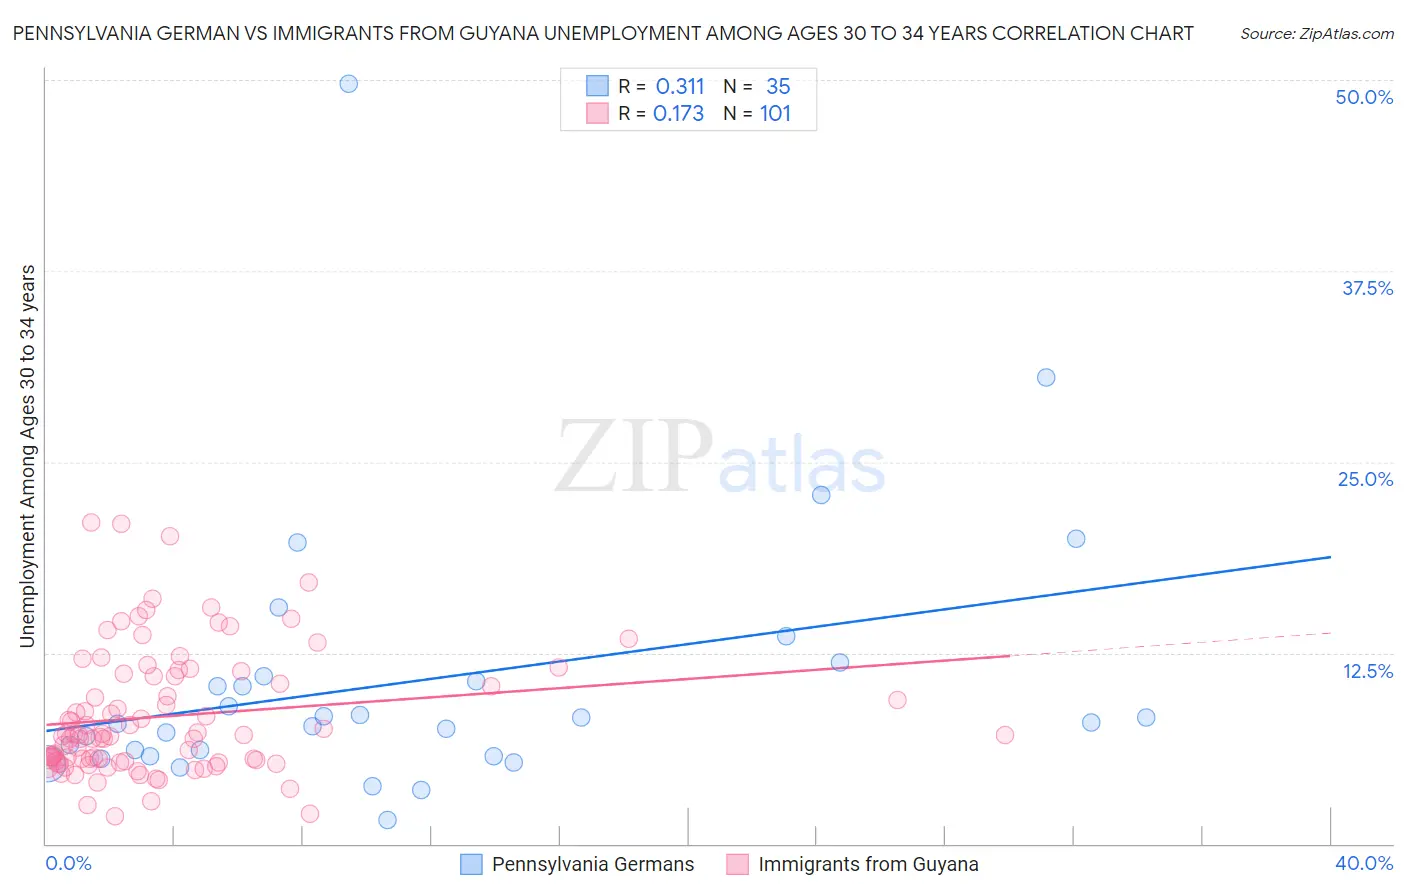
Pennsylvania German vs Immigrants from Guyana Unemployment Among Ages 30 to 34 years Correlation Chart

The statistical analysis conducted on geographies consisting of 219,823,756 people shows a mild positive correlation between the proportion of Pennsylvania Germans and unemployment rate among population between the ages 30 and 34 in the United States with a correlation coefficient (R) of 0.311 and weighted average of 6.3%. Similarly, the statistical analysis conducted on geographies consisting of 178,683,366 people shows a poor positive correlation between the proportion of Immigrants from Guyana and unemployment rate among population between the ages 30 and 34 in the United States with a correlation coefficient (R) of 0.173 and weighted average of 7.2%, a difference of 14.7%.
Pennsylvania German vs Immigrants from Guyana Unemployment Among Ages 30 to 34 years

Unemployment Among Ages 30 to 34 years Correlation Summary

MeasurementPennsylvania GermanImmigrants from Guyana
Minimum1.6%1.8%
Maximum49.8%21.0%
Range48.2%19.2%
Mean10.7%8.3%
Median7.9%7.1%
Interquartile 25% (IQ1)5.8%5.4%
Interquartile 75% (IQ3)11.0%11.1%
Interquartile Range (IQR)5.2%5.6%
Standard Deviation (Sample)9.0%4.1%
Standard Deviation (Population)8.9%4.1%

Similar Demographics by Unemployment Among Ages 30 to 34 years

Demographics Similar to Pennsylvania Germans by Unemployment Among Ages 30 to 34 years

In terms of unemployment among ages 30 to 34 years, the demographic groups most similar to Pennsylvania Germans are Ecuadorian (6.3%, a difference of 0.050%), U.S. Virgin Islander (6.3%, a difference of 0.16%), Ottawa (6.3%, a difference of 0.17%), Blackfeet (6.3%, a difference of 0.18%), and Comanche (6.3%, a difference of 0.29%).
DemographicsRating | RankUnemployment Among Ages 30 to 34 years
French American Indians
0.0
/100
|
#269
Tragic
6.3%
Immigrants | Senegal
0.0
/100
|
#270
Tragic
6.3%
Comanche
0.0
/100
|
#271
Tragic
6.3%
Blackfeet
0.0
/100
|
#272
Tragic
6.3%
Ottawa
0.0
/100
|
#273
Tragic
6.3%
U.S. Virgin Islanders
0.0
/100
|
#274
Tragic
6.3%
Ecuadorians
0.0
/100
|
#275
Tragic
6.3%
Pennsylvania Germans
0.0
/100
|
#276
Tragic
6.3%
Immigrants | Ecuador
0.0
/100
|
#277
Tragic
6.3%
Osage
0.0
/100
|
#278
Tragic
6.3%
Cree
0.0
/100
|
#279
Tragic
6.4%
Cherokee
0.0
/100
|
#280
Tragic
6.4%
Immigrants | Caribbean
0.0
/100
|
#281
Tragic
6.4%
Africans
0.0
/100
|
#282
Tragic
6.4%
Hispanics or Latinos
0.0
/100
|
#283
Tragic
6.4%

Demographics Similar to Immigrants from Guyana by Unemployment Among Ages 30 to 34 years

In terms of unemployment among ages 30 to 34 years, the demographic groups most similar to Immigrants from Guyana are Cape Verdean (7.2%, a difference of 0.29%), Guyanese (7.2%, a difference of 0.31%), Black/African American (7.2%, a difference of 0.38%), Immigrants from Cabo Verde (7.2%, a difference of 0.48%), and Marshallese (7.2%, a difference of 0.50%).
DemographicsRating | RankUnemployment Among Ages 30 to 34 years
Lumbee
0.0
/100
|
#314
Tragic
7.1%
Aleuts
0.0
/100
|
#315
Tragic
7.1%
Houma
0.0
/100
|
#316
Tragic
7.2%
Immigrants | Cabo Verde
0.0
/100
|
#317
Tragic
7.2%
Blacks/African Americans
0.0
/100
|
#318
Tragic
7.2%
Guyanese
0.0
/100
|
#319
Tragic
7.2%
Cape Verdeans
0.0
/100
|
#320
Tragic
7.2%
Immigrants | Guyana
0.0
/100
|
#321
Tragic
7.2%
Marshallese
0.0
/100
|
#322
Tragic
7.2%
Immigrants | Yemen
0.0
/100
|
#323
Tragic
7.3%
Immigrants | Dominica
0.0
/100
|
#324
Tragic
7.3%
Apache
0.0
/100
|
#325
Tragic
7.3%
Dominicans
0.0
/100
|
#326
Tragic
7.7%
Immigrants | Dominican Republic
0.0
/100
|
#327
Tragic
7.7%
Chippewa
0.0
/100
|
#328
Tragic
7.8%