Palestinian vs Ugandan Male Disability
COMPARE
Palestinian
Ugandan
Male Disability
Male Disability Comparison
Palestinians
Ugandans
10.7%
MALE DISABILITY
97.4/ 100
METRIC RATING
92nd/ 347
METRIC RANK
11.0%
MALE DISABILITY
83.9/ 100
METRIC RATING
133rd/ 347
METRIC RANK
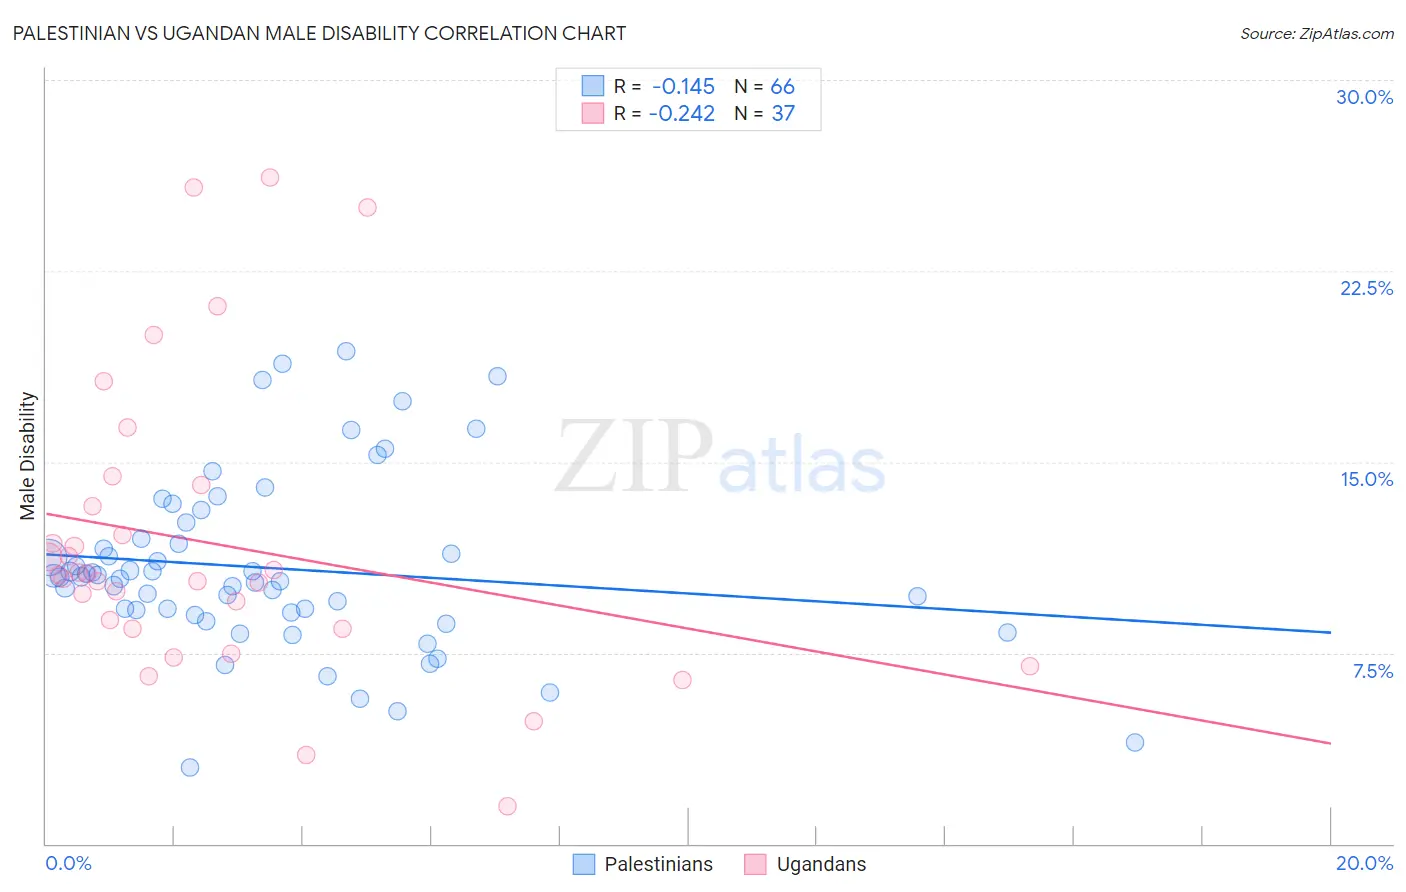
Palestinian vs Ugandan Male Disability Correlation Chart
The statistical analysis conducted on geographies consisting of 216,464,245 people shows a poor negative correlation between the proportion of Palestinians and percentage of males with a disability in the United States with a correlation coefficient (R) of -0.145 and weighted average of 10.7%. Similarly, the statistical analysis conducted on geographies consisting of 94,018,576 people shows a weak negative correlation between the proportion of Ugandans and percentage of males with a disability in the United States with a correlation coefficient (R) of -0.242 and weighted average of 11.0%, a difference of 2.9%.
Male Disability Correlation Summary
| Measurement | Palestinian | Ugandan |
| Minimum | 3.0% | 1.5% |
| Maximum | 19.3% | 26.2% |
| Range | 16.3% | 24.7% |
| Mean | 10.8% | 11.8% |
| Median | 10.5% | 10.6% |
| Interquartile 25% (IQ1) | 9.1% | 8.4% |
| Interquartile 75% (IQ3) | 12.0% | 13.7% |
| Interquartile Range (IQR) | 2.9% | 5.2% |
| Standard Deviation (Sample) | 3.4% | 5.8% |
| Standard Deviation (Population) | 3.4% | 5.7% |
Similar Demographics by Male Disability
Demographics Similar to Palestinians by Male Disability
In terms of male disability, the demographic groups most similar to Palestinians are Immigrants from St. Vincent and the Grenadines (10.7%, a difference of 0.13%), Immigrants from France (10.6%, a difference of 0.15%), Immigrants from Morocco (10.6%, a difference of 0.18%), Immigrants from Western Asia (10.6%, a difference of 0.24%), and Immigrants from Nicaragua (10.6%, a difference of 0.24%).
| Demographics | Rating | Rank | Male Disability |
| Sri Lankans | 97.9 /100 | #85 | Exceptional 10.6% |
| Immigrants | Ireland | 97.9 /100 | #86 | Exceptional 10.6% |
| Immigrants | Vietnam | 97.9 /100 | #87 | Exceptional 10.6% |
| Immigrants | Western Asia | 97.8 /100 | #88 | Exceptional 10.6% |
| Immigrants | Nicaragua | 97.8 /100 | #89 | Exceptional 10.6% |
| Immigrants | Morocco | 97.7 /100 | #90 | Exceptional 10.6% |
| Immigrants | France | 97.6 /100 | #91 | Exceptional 10.6% |
| Palestinians | 97.4 /100 | #92 | Exceptional 10.7% |
| Immigrants | St. Vincent and the Grenadines | 97.1 /100 | #93 | Exceptional 10.7% |
| Immigrants | Sweden | 96.9 /100 | #94 | Exceptional 10.7% |
| Chileans | 96.9 /100 | #95 | Exceptional 10.7% |
| Nicaraguans | 96.6 /100 | #96 | Exceptional 10.7% |
| Immigrants | Armenia | 96.6 /100 | #97 | Exceptional 10.7% |
| Immigrants | Romania | 96.5 /100 | #98 | Exceptional 10.7% |
| Immigrants | Switzerland | 96.1 /100 | #99 | Exceptional 10.7% |
Demographics Similar to Ugandans by Male Disability
In terms of male disability, the demographic groups most similar to Ugandans are Immigrants from Fiji (11.0%, a difference of 0.010%), Macedonian (11.0%, a difference of 0.030%), Bhutanese (11.0%, a difference of 0.050%), Trinidadian and Tobagonian (11.0%, a difference of 0.070%), and Immigrants from Costa Rica (11.0%, a difference of 0.11%).
| Demographics | Rating | Rank | Male Disability |
| Immigrants | Trinidad and Tobago | 86.9 /100 | #126 | Excellent 10.9% |
| Immigrants | Ukraine | 86.8 /100 | #127 | Excellent 10.9% |
| Immigrants | Latvia | 85.5 /100 | #128 | Excellent 10.9% |
| Immigrants | Philippines | 85.4 /100 | #129 | Excellent 10.9% |
| Brazilians | 85.4 /100 | #130 | Excellent 10.9% |
| Macedonians | 84.2 /100 | #131 | Excellent 11.0% |
| Immigrants | Fiji | 84.0 /100 | #132 | Excellent 11.0% |
| Ugandans | 83.9 /100 | #133 | Excellent 11.0% |
| Bhutanese | 83.4 /100 | #134 | Excellent 11.0% |
| Trinidadians and Tobagonians | 83.3 /100 | #135 | Excellent 11.0% |
| Immigrants | Costa Rica | 82.8 /100 | #136 | Excellent 11.0% |
| Immigrants | Europe | 82.0 /100 | #137 | Excellent 11.0% |
| Nigerians | 81.9 /100 | #138 | Excellent 11.0% |
| South Africans | 81.7 /100 | #139 | Excellent 11.0% |
| Immigrants | Italy | 81.5 /100 | #140 | Excellent 11.0% |