Immigrants from Japan vs Ugandan Male Disability
COMPARE
Immigrants from Japan
Ugandan
Male Disability
Male Disability Comparison
Immigrants from Japan
Ugandans
10.4%
MALE DISABILITY
99.5/ 100
METRIC RATING
58th/ 347
METRIC RANK
11.0%
MALE DISABILITY
83.9/ 100
METRIC RATING
133rd/ 347
METRIC RANK
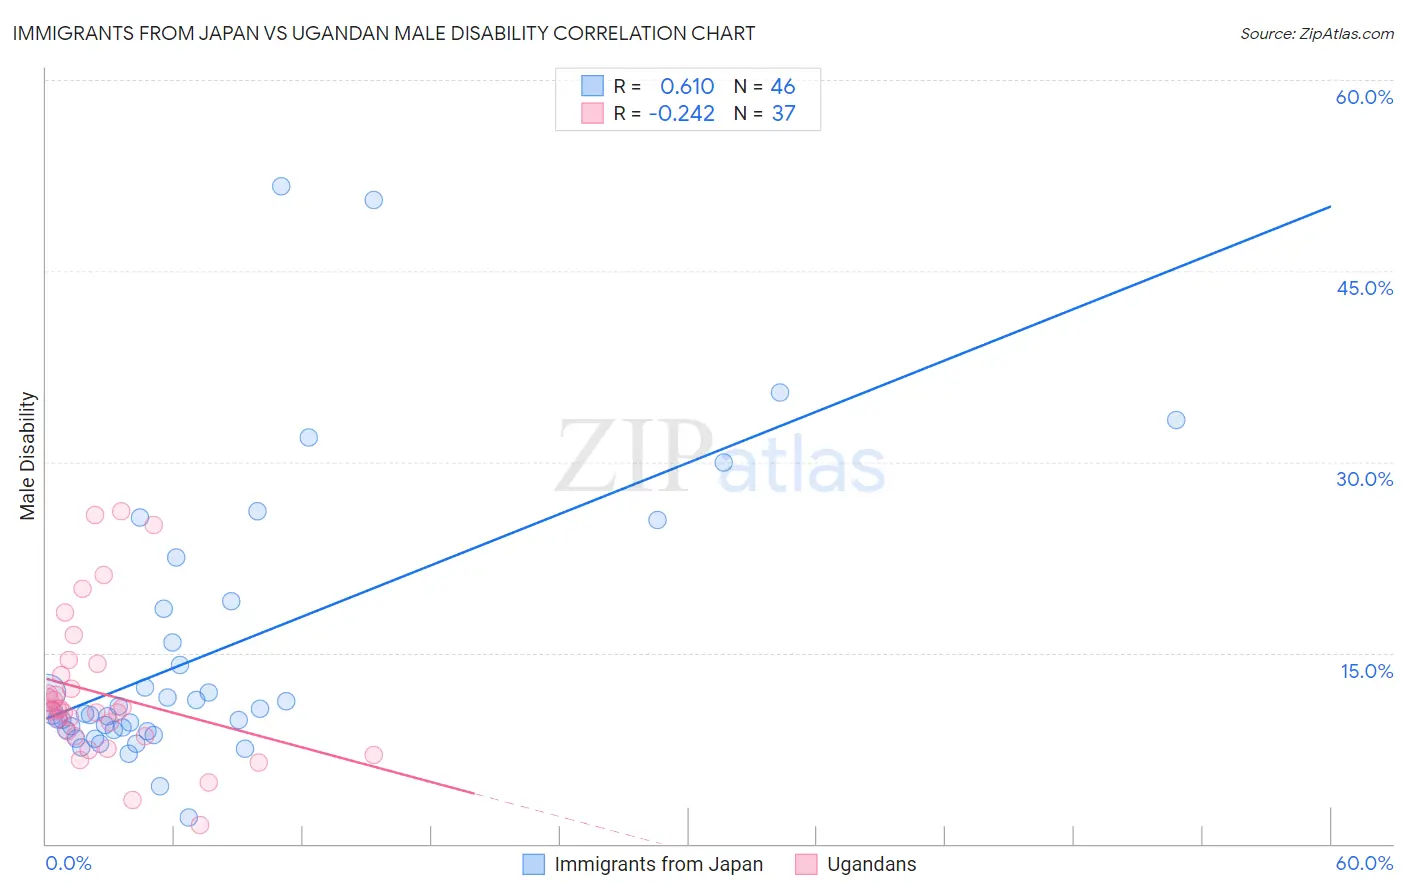
Immigrants from Japan vs Ugandan Male Disability Correlation Chart
The statistical analysis conducted on geographies consisting of 340,135,143 people shows a significant positive correlation between the proportion of Immigrants from Japan and percentage of males with a disability in the United States with a correlation coefficient (R) of 0.610 and weighted average of 10.4%. Similarly, the statistical analysis conducted on geographies consisting of 94,018,576 people shows a weak negative correlation between the proportion of Ugandans and percentage of males with a disability in the United States with a correlation coefficient (R) of -0.242 and weighted average of 11.0%, a difference of 5.6%.
Male Disability Correlation Summary
| Measurement | Immigrants from Japan | Ugandan |
| Minimum | 2.1% | 1.5% |
| Maximum | 51.6% | 26.2% |
| Range | 49.5% | 24.7% |
| Mean | 15.1% | 11.8% |
| Median | 10.2% | 10.6% |
| Interquartile 25% (IQ1) | 8.9% | 8.4% |
| Interquartile 75% (IQ3) | 18.5% | 13.7% |
| Interquartile Range (IQR) | 9.6% | 5.2% |
| Standard Deviation (Sample) | 11.1% | 5.8% |
| Standard Deviation (Population) | 11.0% | 5.7% |
Similar Demographics by Male Disability
Demographics Similar to Immigrants from Japan by Male Disability
In terms of male disability, the demographic groups most similar to Immigrants from Japan are Immigrants from South America (10.4%, a difference of 0.070%), Tongan (10.4%, a difference of 0.10%), Immigrants from Eritrea (10.4%, a difference of 0.14%), Immigrants from Australia (10.4%, a difference of 0.14%), and Peruvian (10.4%, a difference of 0.15%).
| Demographics | Rating | Rank | Male Disability |
| Salvadorans | 99.6 /100 | #51 | Exceptional 10.4% |
| Immigrants | Saudi Arabia | 99.6 /100 | #52 | Exceptional 10.4% |
| Immigrants | Uzbekistan | 99.6 /100 | #53 | Exceptional 10.4% |
| Peruvians | 99.6 /100 | #54 | Exceptional 10.4% |
| Immigrants | Eritrea | 99.6 /100 | #55 | Exceptional 10.4% |
| Tongans | 99.6 /100 | #56 | Exceptional 10.4% |
| Immigrants | South America | 99.6 /100 | #57 | Exceptional 10.4% |
| Immigrants | Japan | 99.5 /100 | #58 | Exceptional 10.4% |
| Immigrants | Australia | 99.5 /100 | #59 | Exceptional 10.4% |
| Immigrants | Colombia | 99.5 /100 | #60 | Exceptional 10.4% |
| Immigrants | Northern Africa | 99.4 /100 | #61 | Exceptional 10.4% |
| Immigrants | Ecuador | 99.3 /100 | #62 | Exceptional 10.4% |
| Immigrants | Belarus | 99.3 /100 | #63 | Exceptional 10.4% |
| Jordanians | 99.3 /100 | #64 | Exceptional 10.5% |
| Immigrants | Grenada | 99.2 /100 | #65 | Exceptional 10.5% |
Demographics Similar to Ugandans by Male Disability
In terms of male disability, the demographic groups most similar to Ugandans are Immigrants from Fiji (11.0%, a difference of 0.010%), Macedonian (11.0%, a difference of 0.030%), Bhutanese (11.0%, a difference of 0.050%), Trinidadian and Tobagonian (11.0%, a difference of 0.070%), and Immigrants from Costa Rica (11.0%, a difference of 0.11%).
| Demographics | Rating | Rank | Male Disability |
| Immigrants | Trinidad and Tobago | 86.9 /100 | #126 | Excellent 10.9% |
| Immigrants | Ukraine | 86.8 /100 | #127 | Excellent 10.9% |
| Immigrants | Latvia | 85.5 /100 | #128 | Excellent 10.9% |
| Immigrants | Philippines | 85.4 /100 | #129 | Excellent 10.9% |
| Brazilians | 85.4 /100 | #130 | Excellent 10.9% |
| Macedonians | 84.2 /100 | #131 | Excellent 11.0% |
| Immigrants | Fiji | 84.0 /100 | #132 | Excellent 11.0% |
| Ugandans | 83.9 /100 | #133 | Excellent 11.0% |
| Bhutanese | 83.4 /100 | #134 | Excellent 11.0% |
| Trinidadians and Tobagonians | 83.3 /100 | #135 | Excellent 11.0% |
| Immigrants | Costa Rica | 82.8 /100 | #136 | Excellent 11.0% |
| Immigrants | Europe | 82.0 /100 | #137 | Excellent 11.0% |
| Nigerians | 81.9 /100 | #138 | Excellent 11.0% |
| South Africans | 81.7 /100 | #139 | Excellent 11.0% |
| Immigrants | Italy | 81.5 /100 | #140 | Excellent 11.0% |