Palestinian vs Ugandan Householder Income Under 25 years
COMPARE
Palestinian
Ugandan
Householder Income Under 25 years
Householder Income Under 25 years Comparison
Palestinians
Ugandans
$51,515
HOUSEHOLDER INCOME UNDER 25 YEARS
16.1/ 100
METRIC RATING
196th/ 347
METRIC RANK
$50,923
HOUSEHOLDER INCOME UNDER 25 YEARS
4.3/ 100
METRIC RATING
231st/ 347
METRIC RANK
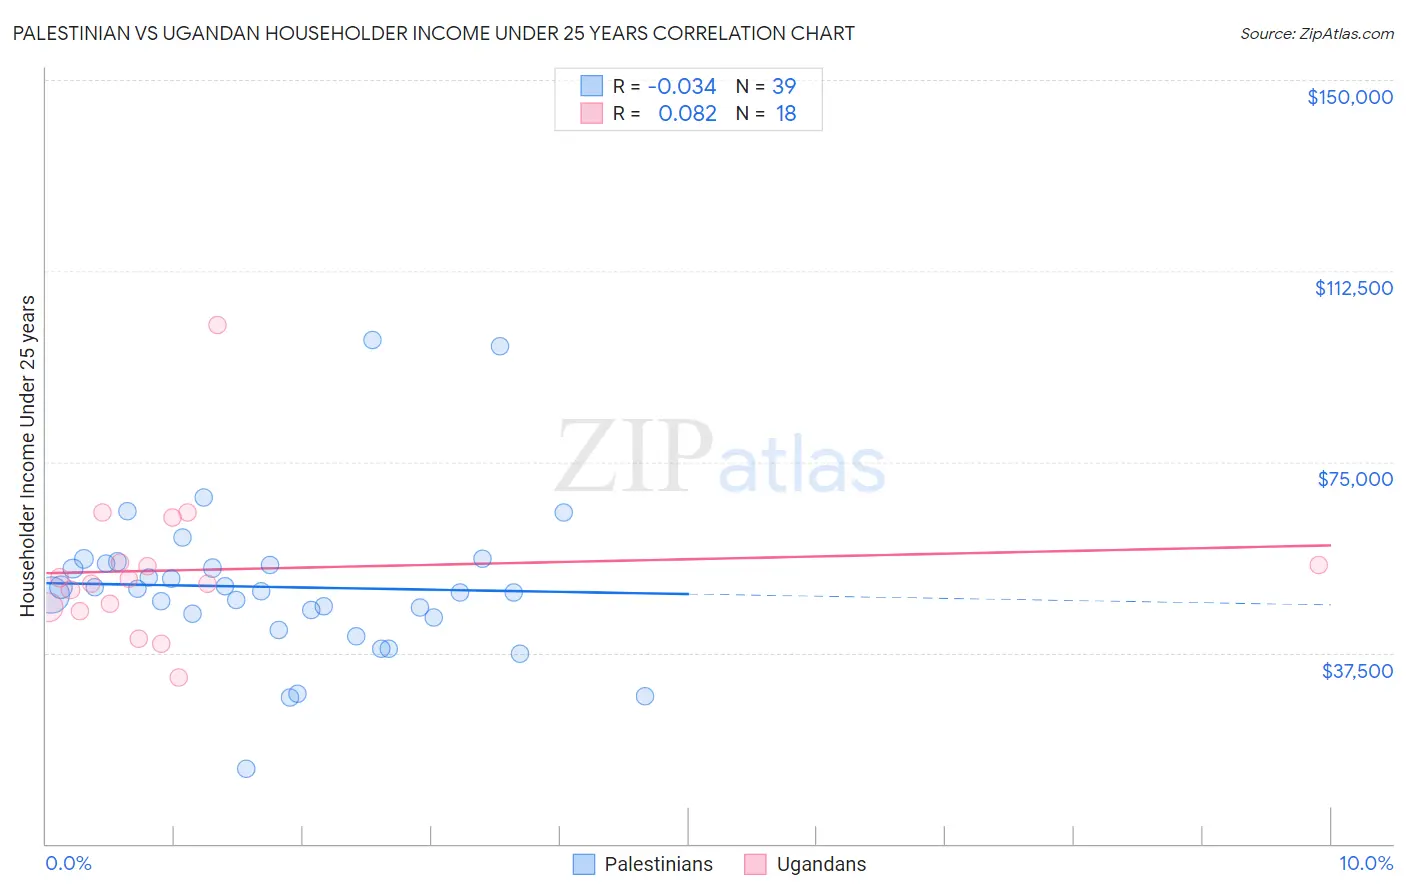
Palestinian vs Ugandan Householder Income Under 25 years Correlation Chart
The statistical analysis conducted on geographies consisting of 193,687,926 people shows no correlation between the proportion of Palestinians and household income with householder under the age of 25 in the United States with a correlation coefficient (R) of -0.034 and weighted average of $51,515. Similarly, the statistical analysis conducted on geographies consisting of 89,521,491 people shows a slight positive correlation between the proportion of Ugandans and household income with householder under the age of 25 in the United States with a correlation coefficient (R) of 0.082 and weighted average of $50,923, a difference of 1.2%.
Householder Income Under 25 years Correlation Summary
| Measurement | Palestinian | Ugandan |
| Minimum | $14,826 | $32,682 |
| Maximum | $98,850 | $101,868 |
| Range | $84,024 | $69,186 |
| Mean | $50,413 | $53,778 |
| Median | $49,499 | $51,561 |
| Interquartile 25% (IQ1) | $44,436 | $46,457 |
| Interquartile 75% (IQ3) | $54,961 | $55,330 |
| Interquartile Range (IQR) | $10,525 | $8,874 |
| Standard Deviation (Sample) | $15,380 | $14,802 |
| Standard Deviation (Population) | $15,181 | $14,385 |
Similar Demographics by Householder Income Under 25 years
Demographics Similar to Palestinians by Householder Income Under 25 years
In terms of householder income under 25 years, the demographic groups most similar to Palestinians are Guatemalan ($51,525, a difference of 0.020%), Estonian ($51,523, a difference of 0.020%), Pima ($51,503, a difference of 0.020%), Immigrants from Syria ($51,494, a difference of 0.040%), and Swiss ($51,493, a difference of 0.040%).
| Demographics | Rating | Rank | Householder Income Under 25 years |
| Croatians | 21.6 /100 | #189 | Fair $51,662 |
| Malaysians | 19.7 /100 | #190 | Poor $51,615 |
| Panamanians | 19.5 /100 | #191 | Poor $51,611 |
| West Indians | 18.5 /100 | #192 | Poor $51,583 |
| Immigrants | Eritrea | 18.1 /100 | #193 | Poor $51,574 |
| Guatemalans | 16.4 /100 | #194 | Poor $51,525 |
| Estonians | 16.4 /100 | #195 | Poor $51,523 |
| Palestinians | 16.1 /100 | #196 | Poor $51,515 |
| Pima | 15.7 /100 | #197 | Poor $51,503 |
| Immigrants | Syria | 15.4 /100 | #198 | Poor $51,494 |
| Swiss | 15.4 /100 | #199 | Poor $51,493 |
| Immigrants | West Indies | 14.9 /100 | #200 | Poor $51,479 |
| British | 14.9 /100 | #201 | Poor $51,477 |
| Immigrants | Guatemala | 14.0 /100 | #202 | Poor $51,447 |
| Immigrants | Cameroon | 13.6 /100 | #203 | Poor $51,433 |
Demographics Similar to Ugandans by Householder Income Under 25 years
In terms of householder income under 25 years, the demographic groups most similar to Ugandans are Jamaican ($50,929, a difference of 0.010%), Yuman ($50,933, a difference of 0.020%), Slovene ($50,886, a difference of 0.070%), Immigrants from Norway ($50,984, a difference of 0.12%), and Pennsylvania German ($50,852, a difference of 0.14%).
| Demographics | Rating | Rank | Householder Income Under 25 years |
| Belizeans | 6.4 /100 | #224 | Tragic $51,094 |
| Immigrants | Jamaica | 5.6 /100 | #225 | Tragic $51,038 |
| Yugoslavians | 5.5 /100 | #226 | Tragic $51,028 |
| Immigrants | Central America | 5.4 /100 | #227 | Tragic $51,022 |
| Immigrants | Norway | 5.0 /100 | #228 | Tragic $50,984 |
| Yuman | 4.4 /100 | #229 | Tragic $50,933 |
| Jamaicans | 4.4 /100 | #230 | Tragic $50,929 |
| Ugandans | 4.3 /100 | #231 | Tragic $50,923 |
| Slovenes | 4.0 /100 | #232 | Tragic $50,886 |
| Pennsylvania Germans | 3.7 /100 | #233 | Tragic $50,852 |
| Kenyans | 3.3 /100 | #234 | Tragic $50,815 |
| Spanish | 3.3 /100 | #235 | Tragic $50,813 |
| English | 3.3 /100 | #236 | Tragic $50,805 |
| Germans | 3.3 /100 | #237 | Tragic $50,804 |
| Iraqis | 3.2 /100 | #238 | Tragic $50,802 |