Guamanian/Chamorro vs Ugandan Male Disability
COMPARE
Guamanian/Chamorro
Ugandan
Male Disability
Male Disability Comparison
Guamanians/Chamorros
Ugandans
12.0%
MALE DISABILITY
0.5/ 100
METRIC RATING
253rd/ 347
METRIC RANK
11.0%
MALE DISABILITY
83.9/ 100
METRIC RATING
133rd/ 347
METRIC RANK
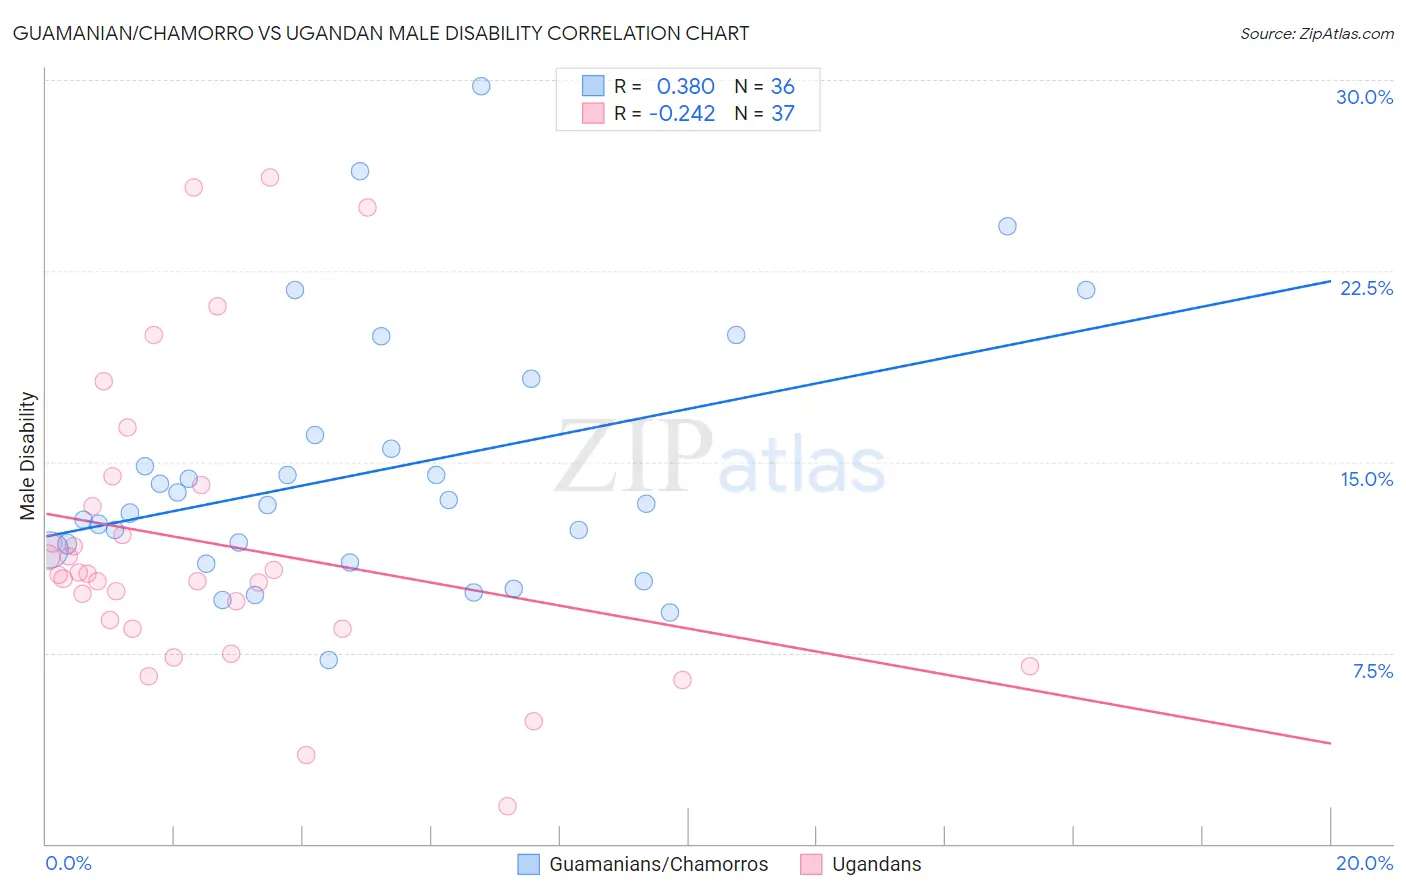
Guamanian/Chamorro vs Ugandan Male Disability Correlation Chart
The statistical analysis conducted on geographies consisting of 221,895,319 people shows a mild positive correlation between the proportion of Guamanians/Chamorros and percentage of males with a disability in the United States with a correlation coefficient (R) of 0.380 and weighted average of 12.0%. Similarly, the statistical analysis conducted on geographies consisting of 94,018,576 people shows a weak negative correlation between the proportion of Ugandans and percentage of males with a disability in the United States with a correlation coefficient (R) of -0.242 and weighted average of 11.0%, a difference of 9.9%.
Male Disability Correlation Summary
| Measurement | Guamanian/Chamorro | Ugandan |
| Minimum | 7.2% | 1.5% |
| Maximum | 29.8% | 26.2% |
| Range | 22.5% | 24.7% |
| Mean | 14.6% | 11.8% |
| Median | 13.3% | 10.6% |
| Interquartile 25% (IQ1) | 11.3% | 8.4% |
| Interquartile 75% (IQ3) | 15.8% | 13.7% |
| Interquartile Range (IQR) | 4.5% | 5.2% |
| Standard Deviation (Sample) | 5.1% | 5.8% |
| Standard Deviation (Population) | 5.0% | 5.7% |
Similar Demographics by Male Disability
Demographics Similar to Guamanians/Chamorros by Male Disability
In terms of male disability, the demographic groups most similar to Guamanians/Chamorros are Slovene (12.0%, a difference of 0.0%), German Russian (12.0%, a difference of 0.070%), Bangladeshi (12.0%, a difference of 0.080%), Immigrants from Yemen (12.0%, a difference of 0.13%), and British (12.1%, a difference of 0.18%).
| Demographics | Rating | Rank | Male Disability |
| Danes | 0.9 /100 | #246 | Tragic 11.9% |
| Hungarians | 0.8 /100 | #247 | Tragic 12.0% |
| Poles | 0.7 /100 | #248 | Tragic 12.0% |
| Immigrants | Yemen | 0.5 /100 | #249 | Tragic 12.0% |
| Bangladeshis | 0.5 /100 | #250 | Tragic 12.0% |
| German Russians | 0.5 /100 | #251 | Tragic 12.0% |
| Slovenes | 0.5 /100 | #252 | Tragic 12.0% |
| Guamanians/Chamorros | 0.5 /100 | #253 | Tragic 12.0% |
| British | 0.4 /100 | #254 | Tragic 12.1% |
| Chinese | 0.4 /100 | #255 | Tragic 12.1% |
| Swiss | 0.3 /100 | #256 | Tragic 12.1% |
| Europeans | 0.3 /100 | #257 | Tragic 12.1% |
| Basques | 0.3 /100 | #258 | Tragic 12.1% |
| Belgians | 0.3 /100 | #259 | Tragic 12.1% |
| Swedes | 0.3 /100 | #260 | Tragic 12.1% |
Demographics Similar to Ugandans by Male Disability
In terms of male disability, the demographic groups most similar to Ugandans are Immigrants from Fiji (11.0%, a difference of 0.010%), Macedonian (11.0%, a difference of 0.030%), Bhutanese (11.0%, a difference of 0.050%), Trinidadian and Tobagonian (11.0%, a difference of 0.070%), and Immigrants from Costa Rica (11.0%, a difference of 0.11%).
| Demographics | Rating | Rank | Male Disability |
| Immigrants | Trinidad and Tobago | 86.9 /100 | #126 | Excellent 10.9% |
| Immigrants | Ukraine | 86.8 /100 | #127 | Excellent 10.9% |
| Immigrants | Latvia | 85.5 /100 | #128 | Excellent 10.9% |
| Immigrants | Philippines | 85.4 /100 | #129 | Excellent 10.9% |
| Brazilians | 85.4 /100 | #130 | Excellent 10.9% |
| Macedonians | 84.2 /100 | #131 | Excellent 11.0% |
| Immigrants | Fiji | 84.0 /100 | #132 | Excellent 11.0% |
| Ugandans | 83.9 /100 | #133 | Excellent 11.0% |
| Bhutanese | 83.4 /100 | #134 | Excellent 11.0% |
| Trinidadians and Tobagonians | 83.3 /100 | #135 | Excellent 11.0% |
| Immigrants | Costa Rica | 82.8 /100 | #136 | Excellent 11.0% |
| Immigrants | Europe | 82.0 /100 | #137 | Excellent 11.0% |
| Nigerians | 81.9 /100 | #138 | Excellent 11.0% |
| South Africans | 81.7 /100 | #139 | Excellent 11.0% |
| Immigrants | Italy | 81.5 /100 | #140 | Excellent 11.0% |