Palestinian vs Alaska Native Male Disability
COMPARE
Palestinian
Alaska Native
Male Disability
Male Disability Comparison
Palestinians
Alaska Natives
10.7%
MALE DISABILITY
97.4/ 100
METRIC RATING
92nd/ 347
METRIC RANK
13.6%
MALE DISABILITY
0.0/ 100
METRIC RATING
316th/ 347
METRIC RANK
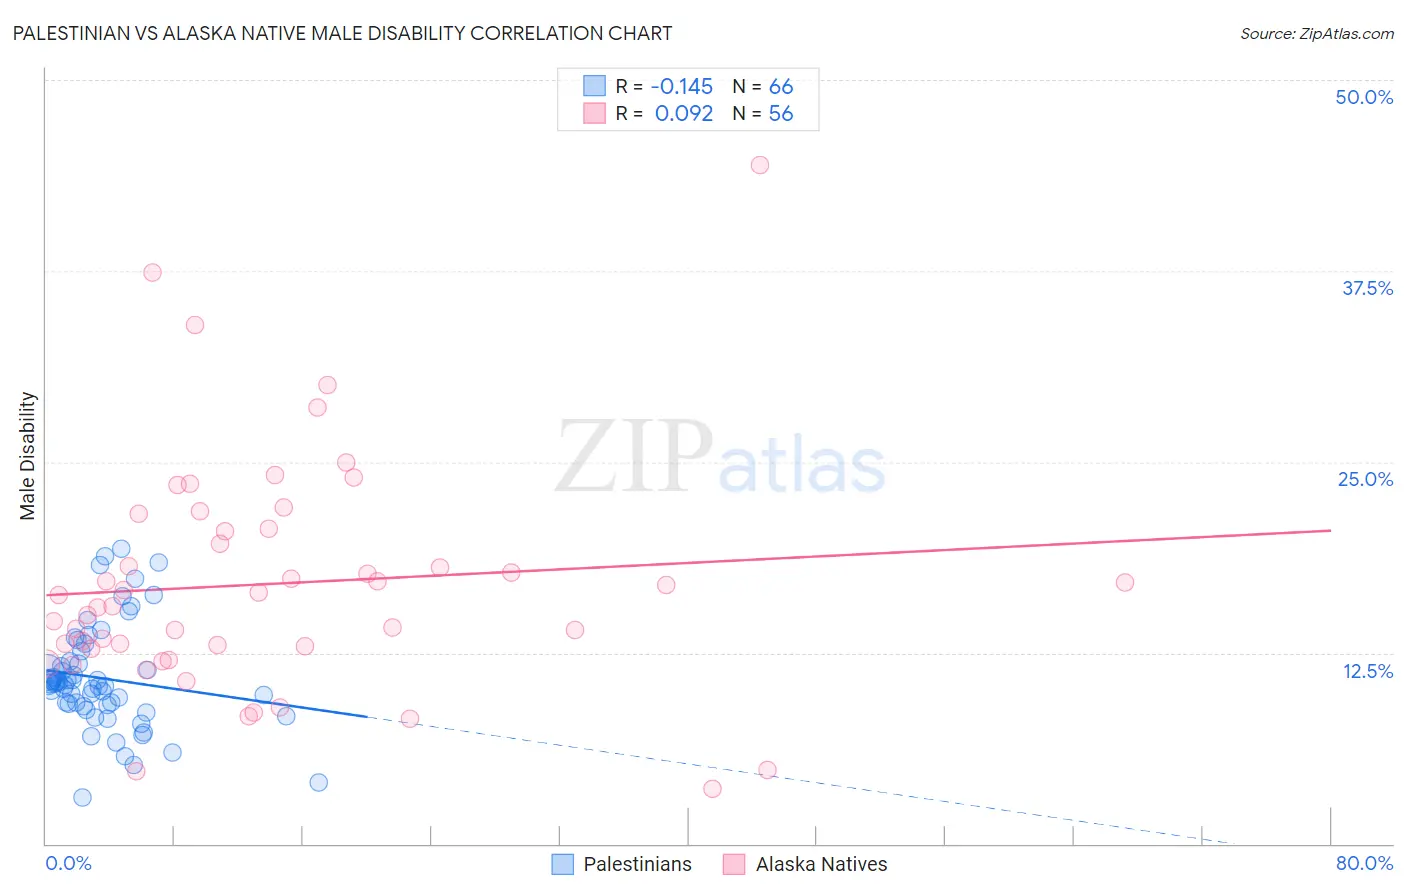
Palestinian vs Alaska Native Male Disability Correlation Chart
The statistical analysis conducted on geographies consisting of 216,464,245 people shows a poor negative correlation between the proportion of Palestinians and percentage of males with a disability in the United States with a correlation coefficient (R) of -0.145 and weighted average of 10.7%. Similarly, the statistical analysis conducted on geographies consisting of 76,765,214 people shows a slight positive correlation between the proportion of Alaska Natives and percentage of males with a disability in the United States with a correlation coefficient (R) of 0.092 and weighted average of 13.6%, a difference of 27.4%.
Male Disability Correlation Summary
| Measurement | Palestinian | Alaska Native |
| Minimum | 3.0% | 3.6% |
| Maximum | 19.3% | 44.4% |
| Range | 16.3% | 40.8% |
| Mean | 10.8% | 17.0% |
| Median | 10.5% | 15.9% |
| Interquartile 25% (IQ1) | 9.1% | 12.8% |
| Interquartile 75% (IQ3) | 12.0% | 20.5% |
| Interquartile Range (IQR) | 2.9% | 7.7% |
| Standard Deviation (Sample) | 3.4% | 7.6% |
| Standard Deviation (Population) | 3.4% | 7.6% |
Similar Demographics by Male Disability
Demographics Similar to Palestinians by Male Disability
In terms of male disability, the demographic groups most similar to Palestinians are Immigrants from St. Vincent and the Grenadines (10.7%, a difference of 0.13%), Immigrants from France (10.6%, a difference of 0.15%), Immigrants from Morocco (10.6%, a difference of 0.18%), Immigrants from Western Asia (10.6%, a difference of 0.24%), and Immigrants from Nicaragua (10.6%, a difference of 0.24%).
| Demographics | Rating | Rank | Male Disability |
| Sri Lankans | 97.9 /100 | #85 | Exceptional 10.6% |
| Immigrants | Ireland | 97.9 /100 | #86 | Exceptional 10.6% |
| Immigrants | Vietnam | 97.9 /100 | #87 | Exceptional 10.6% |
| Immigrants | Western Asia | 97.8 /100 | #88 | Exceptional 10.6% |
| Immigrants | Nicaragua | 97.8 /100 | #89 | Exceptional 10.6% |
| Immigrants | Morocco | 97.7 /100 | #90 | Exceptional 10.6% |
| Immigrants | France | 97.6 /100 | #91 | Exceptional 10.6% |
| Palestinians | 97.4 /100 | #92 | Exceptional 10.7% |
| Immigrants | St. Vincent and the Grenadines | 97.1 /100 | #93 | Exceptional 10.7% |
| Immigrants | Sweden | 96.9 /100 | #94 | Exceptional 10.7% |
| Chileans | 96.9 /100 | #95 | Exceptional 10.7% |
| Nicaraguans | 96.6 /100 | #96 | Exceptional 10.7% |
| Immigrants | Armenia | 96.6 /100 | #97 | Exceptional 10.7% |
| Immigrants | Romania | 96.5 /100 | #98 | Exceptional 10.7% |
| Immigrants | Switzerland | 96.1 /100 | #99 | Exceptional 10.7% |
Demographics Similar to Alaska Natives by Male Disability
In terms of male disability, the demographic groups most similar to Alaska Natives are Iroquois (13.6%, a difference of 0.050%), Aleut (13.5%, a difference of 0.21%), Puget Sound Salish (13.5%, a difference of 0.27%), Yakama (13.5%, a difference of 0.29%), and Paiute (13.7%, a difference of 0.80%).
| Demographics | Rating | Rank | Male Disability |
| Blackfeet | 0.0 /100 | #309 | Tragic 13.4% |
| Immigrants | Azores | 0.0 /100 | #310 | Tragic 13.4% |
| Delaware | 0.0 /100 | #311 | Tragic 13.5% |
| Yakama | 0.0 /100 | #312 | Tragic 13.5% |
| Puget Sound Salish | 0.0 /100 | #313 | Tragic 13.5% |
| Aleuts | 0.0 /100 | #314 | Tragic 13.5% |
| Iroquois | 0.0 /100 | #315 | Tragic 13.6% |
| Alaska Natives | 0.0 /100 | #316 | Tragic 13.6% |
| Paiute | 0.0 /100 | #317 | Tragic 13.7% |
| Cree | 0.0 /100 | #318 | Tragic 13.7% |
| Americans | 0.0 /100 | #319 | Tragic 13.8% |
| Tlingit-Haida | 0.0 /100 | #320 | Tragic 13.8% |
| Shoshone | 0.0 /100 | #321 | Tragic 13.8% |
| Apache | 0.0 /100 | #322 | Tragic 14.0% |
| Osage | 0.0 /100 | #323 | Tragic 14.0% |