Palestinian vs Immigrants from Malaysia Male Disability
COMPARE
Palestinian
Immigrants from Malaysia
Male Disability
Male Disability Comparison
Palestinians
Immigrants from Malaysia
10.7%
MALE DISABILITY
97.4/ 100
METRIC RATING
92nd/ 347
METRIC RANK
10.0%
MALE DISABILITY
99.9/ 100
METRIC RATING
25th/ 347
METRIC RANK
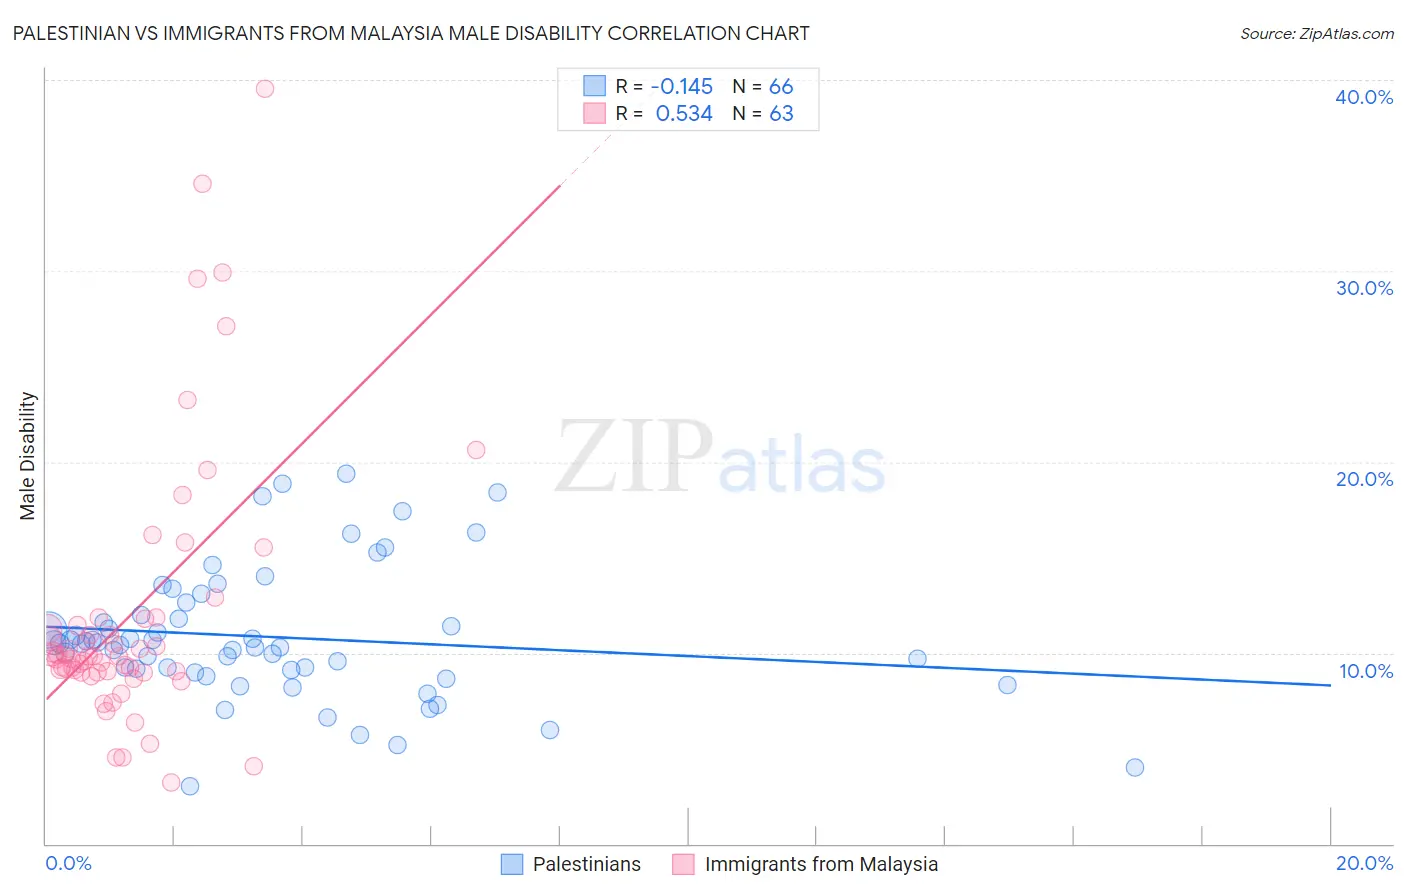
Palestinian vs Immigrants from Malaysia Male Disability Correlation Chart
The statistical analysis conducted on geographies consisting of 216,464,245 people shows a poor negative correlation between the proportion of Palestinians and percentage of males with a disability in the United States with a correlation coefficient (R) of -0.145 and weighted average of 10.7%. Similarly, the statistical analysis conducted on geographies consisting of 197,973,709 people shows a substantial positive correlation between the proportion of Immigrants from Malaysia and percentage of males with a disability in the United States with a correlation coefficient (R) of 0.534 and weighted average of 10.0%, a difference of 6.1%.
Male Disability Correlation Summary
| Measurement | Palestinian | Immigrants from Malaysia |
| Minimum | 3.0% | 3.2% |
| Maximum | 19.3% | 39.6% |
| Range | 16.3% | 36.3% |
| Mean | 10.8% | 12.0% |
| Median | 10.5% | 9.8% |
| Interquartile 25% (IQ1) | 9.1% | 9.0% |
| Interquartile 75% (IQ3) | 12.0% | 11.8% |
| Interquartile Range (IQR) | 2.9% | 2.8% |
| Standard Deviation (Sample) | 3.4% | 7.1% |
| Standard Deviation (Population) | 3.4% | 7.0% |
Similar Demographics by Male Disability
Demographics Similar to Palestinians by Male Disability
In terms of male disability, the demographic groups most similar to Palestinians are Immigrants from St. Vincent and the Grenadines (10.7%, a difference of 0.13%), Immigrants from France (10.6%, a difference of 0.15%), Immigrants from Morocco (10.6%, a difference of 0.18%), Immigrants from Western Asia (10.6%, a difference of 0.24%), and Immigrants from Nicaragua (10.6%, a difference of 0.24%).
| Demographics | Rating | Rank | Male Disability |
| Sri Lankans | 97.9 /100 | #85 | Exceptional 10.6% |
| Immigrants | Ireland | 97.9 /100 | #86 | Exceptional 10.6% |
| Immigrants | Vietnam | 97.9 /100 | #87 | Exceptional 10.6% |
| Immigrants | Western Asia | 97.8 /100 | #88 | Exceptional 10.6% |
| Immigrants | Nicaragua | 97.8 /100 | #89 | Exceptional 10.6% |
| Immigrants | Morocco | 97.7 /100 | #90 | Exceptional 10.6% |
| Immigrants | France | 97.6 /100 | #91 | Exceptional 10.6% |
| Palestinians | 97.4 /100 | #92 | Exceptional 10.7% |
| Immigrants | St. Vincent and the Grenadines | 97.1 /100 | #93 | Exceptional 10.7% |
| Immigrants | Sweden | 96.9 /100 | #94 | Exceptional 10.7% |
| Chileans | 96.9 /100 | #95 | Exceptional 10.7% |
| Nicaraguans | 96.6 /100 | #96 | Exceptional 10.7% |
| Immigrants | Armenia | 96.6 /100 | #97 | Exceptional 10.7% |
| Immigrants | Romania | 96.5 /100 | #98 | Exceptional 10.7% |
| Immigrants | Switzerland | 96.1 /100 | #99 | Exceptional 10.7% |
Demographics Similar to Immigrants from Malaysia by Male Disability
In terms of male disability, the demographic groups most similar to Immigrants from Malaysia are Paraguayan (10.1%, a difference of 0.13%), Immigrants from Asia (10.0%, a difference of 0.19%), Cypriot (10.0%, a difference of 0.32%), Immigrants from Venezuela (10.0%, a difference of 0.41%), and Egyptian (10.1%, a difference of 0.45%).
| Demographics | Rating | Rank | Male Disability |
| Immigrants | Pakistan | 100.0 /100 | #18 | Exceptional 9.8% |
| Immigrants | Sri Lanka | 100.0 /100 | #19 | Exceptional 10.0% |
| Asians | 100.0 /100 | #20 | Exceptional 10.0% |
| Burmese | 100.0 /100 | #21 | Exceptional 10.0% |
| Immigrants | Venezuela | 100.0 /100 | #22 | Exceptional 10.0% |
| Cypriots | 100.0 /100 | #23 | Exceptional 10.0% |
| Immigrants | Asia | 100.0 /100 | #24 | Exceptional 10.0% |
| Immigrants | Malaysia | 99.9 /100 | #25 | Exceptional 10.0% |
| Paraguayans | 99.9 /100 | #26 | Exceptional 10.1% |
| Egyptians | 99.9 /100 | #27 | Exceptional 10.1% |
| Vietnamese | 99.9 /100 | #28 | Exceptional 10.1% |
| Venezuelans | 99.9 /100 | #29 | Exceptional 10.1% |
| Immigrants | Egypt | 99.9 /100 | #30 | Exceptional 10.1% |
| Soviet Union | 99.9 /100 | #31 | Exceptional 10.1% |
| Argentineans | 99.9 /100 | #32 | Exceptional 10.1% |