Palestinian vs Dominican Male Disability
COMPARE
Palestinian
Dominican
Male Disability
Male Disability Comparison
Palestinians
Dominicans
10.7%
MALE DISABILITY
97.4/ 100
METRIC RATING
92nd/ 347
METRIC RANK
11.8%
MALE DISABILITY
1.8/ 100
METRIC RATING
231st/ 347
METRIC RANK
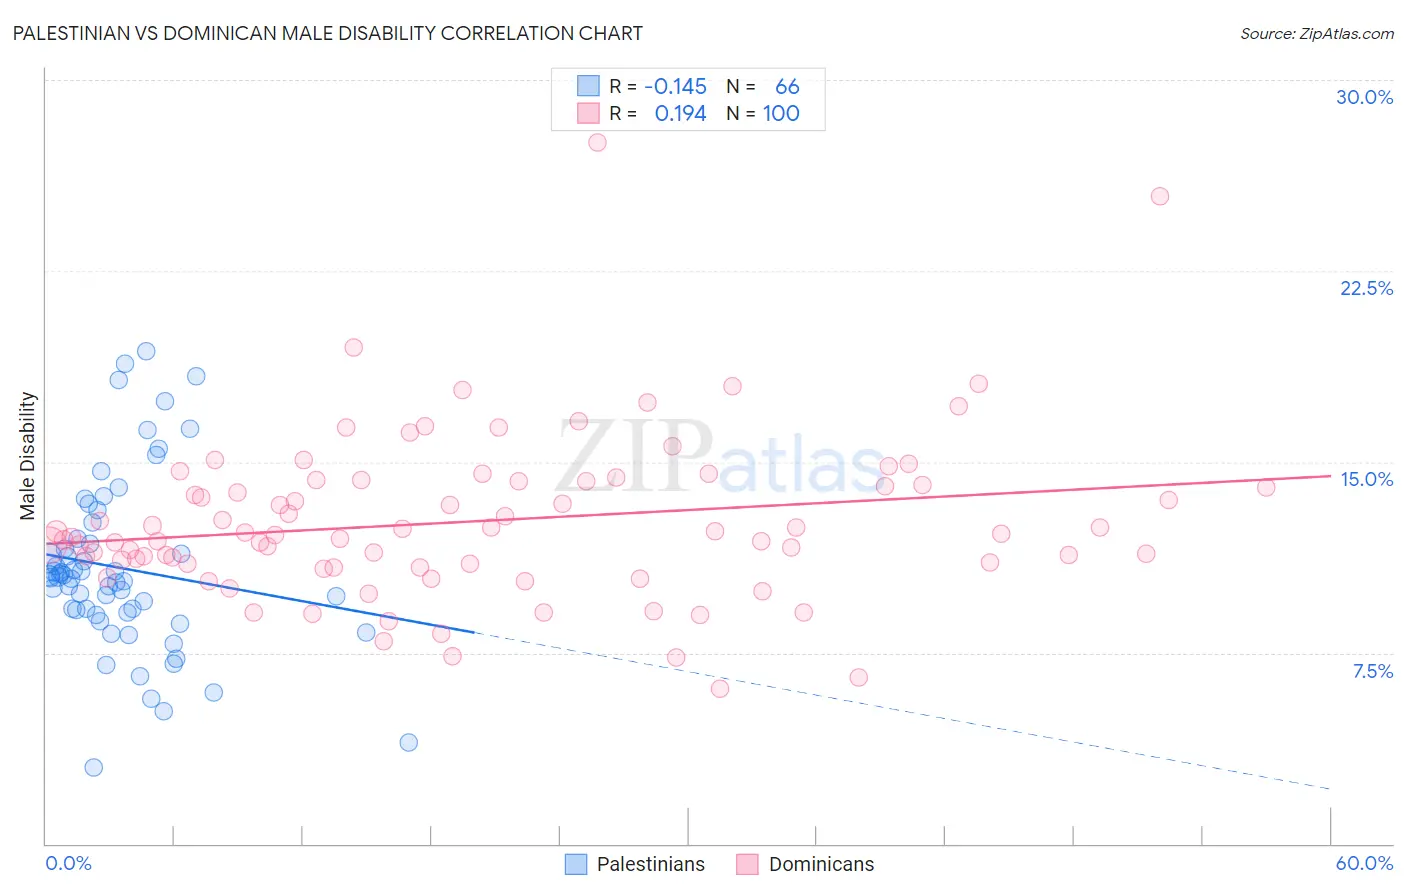
Palestinian vs Dominican Male Disability Correlation Chart
The statistical analysis conducted on geographies consisting of 216,464,245 people shows a poor negative correlation between the proportion of Palestinians and percentage of males with a disability in the United States with a correlation coefficient (R) of -0.145 and weighted average of 10.7%. Similarly, the statistical analysis conducted on geographies consisting of 355,013,685 people shows a poor positive correlation between the proportion of Dominicans and percentage of males with a disability in the United States with a correlation coefficient (R) of 0.194 and weighted average of 11.8%, a difference of 11.1%.
Male Disability Correlation Summary
| Measurement | Palestinian | Dominican |
| Minimum | 3.0% | 6.1% |
| Maximum | 19.3% | 27.5% |
| Range | 16.3% | 21.4% |
| Mean | 10.8% | 12.7% |
| Median | 10.5% | 12.1% |
| Interquartile 25% (IQ1) | 9.1% | 11.0% |
| Interquartile 75% (IQ3) | 12.0% | 14.3% |
| Interquartile Range (IQR) | 2.9% | 3.3% |
| Standard Deviation (Sample) | 3.4% | 3.3% |
| Standard Deviation (Population) | 3.4% | 3.3% |
Similar Demographics by Male Disability
Demographics Similar to Palestinians by Male Disability
In terms of male disability, the demographic groups most similar to Palestinians are Immigrants from St. Vincent and the Grenadines (10.7%, a difference of 0.13%), Immigrants from France (10.6%, a difference of 0.15%), Immigrants from Morocco (10.6%, a difference of 0.18%), Immigrants from Western Asia (10.6%, a difference of 0.24%), and Immigrants from Nicaragua (10.6%, a difference of 0.24%).
| Demographics | Rating | Rank | Male Disability |
| Sri Lankans | 97.9 /100 | #85 | Exceptional 10.6% |
| Immigrants | Ireland | 97.9 /100 | #86 | Exceptional 10.6% |
| Immigrants | Vietnam | 97.9 /100 | #87 | Exceptional 10.6% |
| Immigrants | Western Asia | 97.8 /100 | #88 | Exceptional 10.6% |
| Immigrants | Nicaragua | 97.8 /100 | #89 | Exceptional 10.6% |
| Immigrants | Morocco | 97.7 /100 | #90 | Exceptional 10.6% |
| Immigrants | France | 97.6 /100 | #91 | Exceptional 10.6% |
| Palestinians | 97.4 /100 | #92 | Exceptional 10.7% |
| Immigrants | St. Vincent and the Grenadines | 97.1 /100 | #93 | Exceptional 10.7% |
| Immigrants | Sweden | 96.9 /100 | #94 | Exceptional 10.7% |
| Chileans | 96.9 /100 | #95 | Exceptional 10.7% |
| Nicaraguans | 96.6 /100 | #96 | Exceptional 10.7% |
| Immigrants | Armenia | 96.6 /100 | #97 | Exceptional 10.7% |
| Immigrants | Romania | 96.5 /100 | #98 | Exceptional 10.7% |
| Immigrants | Switzerland | 96.1 /100 | #99 | Exceptional 10.7% |
Demographics Similar to Dominicans by Male Disability
In terms of male disability, the demographic groups most similar to Dominicans are Malaysian (11.8%, a difference of 0.060%), Mexican (11.8%, a difference of 0.10%), Immigrants from Canada (11.9%, a difference of 0.18%), Croatian (11.8%, a difference of 0.20%), and Bermudan (11.8%, a difference of 0.28%).
| Demographics | Rating | Rank | Male Disability |
| Japanese | 3.1 /100 | #224 | Tragic 11.7% |
| Liberians | 3.1 /100 | #225 | Tragic 11.8% |
| Sub-Saharan Africans | 2.8 /100 | #226 | Tragic 11.8% |
| Austrians | 2.5 /100 | #227 | Tragic 11.8% |
| Hispanics or Latinos | 2.3 /100 | #228 | Tragic 11.8% |
| Bermudans | 2.3 /100 | #229 | Tragic 11.8% |
| Croatians | 2.1 /100 | #230 | Tragic 11.8% |
| Dominicans | 1.8 /100 | #231 | Tragic 11.8% |
| Malaysians | 1.8 /100 | #232 | Tragic 11.8% |
| Mexicans | 1.7 /100 | #233 | Tragic 11.8% |
| Immigrants | Canada | 1.6 /100 | #234 | Tragic 11.9% |
| Immigrants | North America | 1.5 /100 | #235 | Tragic 11.9% |
| U.S. Virgin Islanders | 1.3 /100 | #236 | Tragic 11.9% |
| Carpatho Rusyns | 1.3 /100 | #237 | Tragic 11.9% |
| Yugoslavians | 1.2 /100 | #238 | Tragic 11.9% |