Immigrants from Zimbabwe vs Immigrants from Hong Kong Disability
COMPARE
Immigrants from Zimbabwe
Immigrants from Hong Kong
Disability
Disability Comparison
Immigrants from Zimbabwe
Immigrants from Hong Kong
11.2%
DISABILITY
97.7/ 100
METRIC RATING
96th/ 347
METRIC RANK
10.0%
DISABILITY
100.0/ 100
METRIC RATING
9th/ 347
METRIC RANK
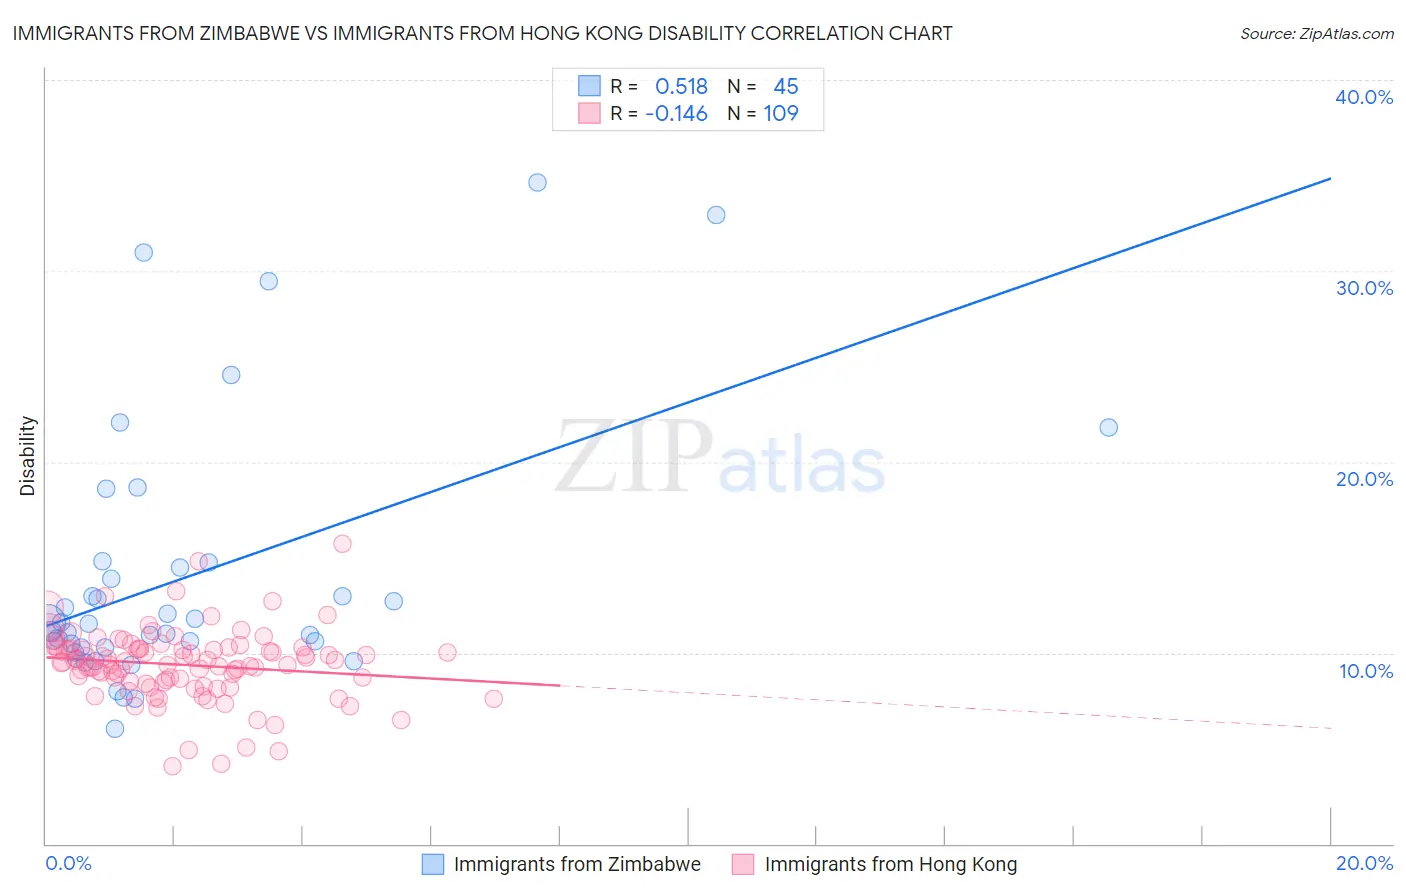
Immigrants from Zimbabwe vs Immigrants from Hong Kong Disability Correlation Chart
The statistical analysis conducted on geographies consisting of 117,811,859 people shows a substantial positive correlation between the proportion of Immigrants from Zimbabwe and percentage of population with a disability in the United States with a correlation coefficient (R) of 0.518 and weighted average of 11.2%. Similarly, the statistical analysis conducted on geographies consisting of 253,995,136 people shows a poor negative correlation between the proportion of Immigrants from Hong Kong and percentage of population with a disability in the United States with a correlation coefficient (R) of -0.146 and weighted average of 10.0%, a difference of 11.8%.
Disability Correlation Summary
| Measurement | Immigrants from Zimbabwe | Immigrants from Hong Kong |
| Minimum | 6.0% | 4.0% |
| Maximum | 34.6% | 15.7% |
| Range | 28.6% | 11.7% |
| Mean | 14.0% | 9.4% |
| Median | 11.5% | 9.5% |
| Interquartile 25% (IQ1) | 10.3% | 8.5% |
| Interquartile 75% (IQ3) | 14.6% | 10.2% |
| Interquartile Range (IQR) | 4.3% | 1.8% |
| Standard Deviation (Sample) | 6.8% | 1.9% |
| Standard Deviation (Population) | 6.8% | 1.9% |
Similar Demographics by Disability
Demographics Similar to Immigrants from Zimbabwe by Disability
In terms of disability, the demographic groups most similar to Immigrants from Zimbabwe are Eastern European (11.2%, a difference of 0.060%), Immigrants from Morocco (11.2%, a difference of 0.070%), Bhutanese (11.2%, a difference of 0.14%), Uruguayan (11.2%, a difference of 0.14%), and Immigrants from Czechoslovakia (11.2%, a difference of 0.15%).
| Demographics | Rating | Rank | Disability |
| Immigrants | South Africa | 98.2 /100 | #89 | Exceptional 11.2% |
| Immigrants | Brazil | 98.1 /100 | #90 | Exceptional 11.2% |
| Immigrants | Western Asia | 98.1 /100 | #91 | Exceptional 11.2% |
| Ecuadorians | 98.0 /100 | #92 | Exceptional 11.2% |
| Immigrants | Ecuador | 98.0 /100 | #93 | Exceptional 11.2% |
| Immigrants | Morocco | 97.8 /100 | #94 | Exceptional 11.2% |
| Eastern Europeans | 97.8 /100 | #95 | Exceptional 11.2% |
| Immigrants | Zimbabwe | 97.7 /100 | #96 | Exceptional 11.2% |
| Bhutanese | 97.4 /100 | #97 | Exceptional 11.2% |
| Uruguayans | 97.4 /100 | #98 | Exceptional 11.2% |
| Immigrants | Czechoslovakia | 97.4 /100 | #99 | Exceptional 11.2% |
| Immigrants | Greece | 96.9 /100 | #100 | Exceptional 11.3% |
| Immigrants | Nicaragua | 96.8 /100 | #101 | Exceptional 11.3% |
| Immigrants | Eastern Africa | 96.7 /100 | #102 | Exceptional 11.3% |
| Immigrants | Uruguay | 96.4 /100 | #103 | Exceptional 11.3% |
Demographics Similar to Immigrants from Hong Kong by Disability
In terms of disability, the demographic groups most similar to Immigrants from Hong Kong are Bolivian (10.0%, a difference of 0.30%), Immigrants from Singapore (10.0%, a difference of 0.52%), Immigrants from China (10.1%, a difference of 0.81%), Iranian (10.1%, a difference of 0.82%), and Immigrants from South Central Asia (9.9%, a difference of 0.84%).
| Demographics | Rating | Rank | Disability |
| Filipinos | 100.0 /100 | #2 | Exceptional 9.6% |
| Immigrants | Taiwan | 100.0 /100 | #3 | Exceptional 9.6% |
| Thais | 100.0 /100 | #4 | Exceptional 9.7% |
| Immigrants | Bolivia | 100.0 /100 | #5 | Exceptional 9.9% |
| Immigrants | South Central Asia | 100.0 /100 | #6 | Exceptional 9.9% |
| Immigrants | Singapore | 100.0 /100 | #7 | Exceptional 10.0% |
| Bolivians | 100.0 /100 | #8 | Exceptional 10.0% |
| Immigrants | Hong Kong | 100.0 /100 | #9 | Exceptional 10.0% |
| Immigrants | China | 100.0 /100 | #10 | Exceptional 10.1% |
| Iranians | 100.0 /100 | #11 | Exceptional 10.1% |
| Immigrants | Israel | 100.0 /100 | #12 | Exceptional 10.1% |
| Immigrants | Eastern Asia | 100.0 /100 | #13 | Exceptional 10.2% |
| Immigrants | Korea | 100.0 /100 | #14 | Exceptional 10.2% |
| Okinawans | 100.0 /100 | #15 | Exceptional 10.3% |
| Indians (Asian) | 100.0 /100 | #16 | Exceptional 10.3% |