Palestinian vs Immigrants from Hong Kong Unemployment Among Ages 25 to 29 years
COMPARE
Palestinian
Immigrants from Hong Kong
Unemployment Among Ages 25 to 29 years
Unemployment Among Ages 25 to 29 years Comparison
Palestinians
Immigrants from Hong Kong
6.3%
UNEMPLOYMENT AMONG AGES 25 TO 29 YEARS
97.7/ 100
METRIC RATING
68th/ 347
METRIC RANK
6.3%
UNEMPLOYMENT AMONG AGES 25 TO 29 YEARS
97.5/ 100
METRIC RATING
69th/ 347
METRIC RANK
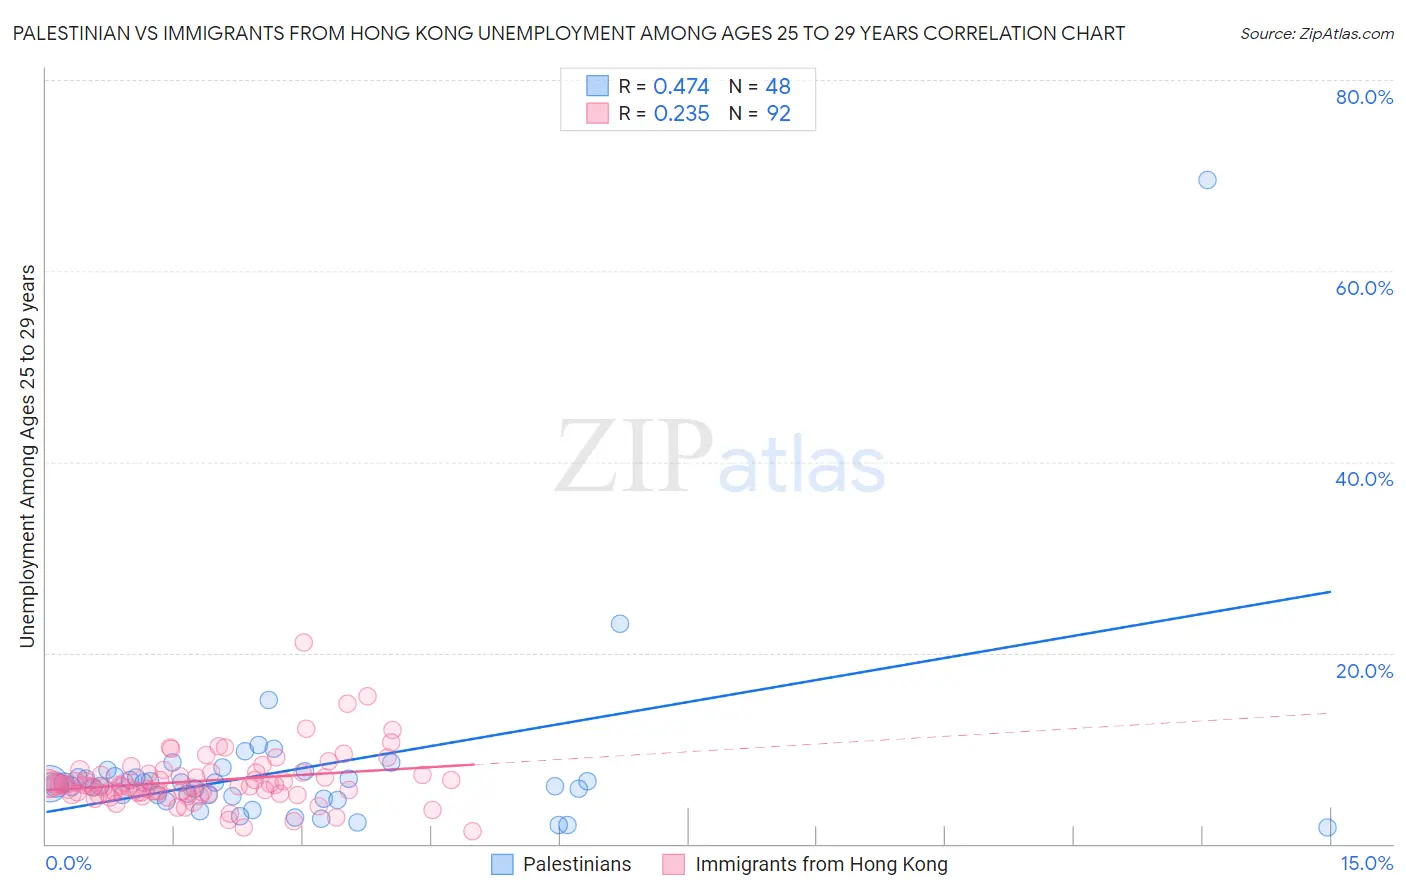
Palestinian vs Immigrants from Hong Kong Unemployment Among Ages 25 to 29 years Correlation Chart
The statistical analysis conducted on geographies consisting of 211,975,975 people shows a moderate positive correlation between the proportion of Palestinians and unemployment rate among population between the ages 25 and 29 in the United States with a correlation coefficient (R) of 0.474 and weighted average of 6.3%. Similarly, the statistical analysis conducted on geographies consisting of 247,463,754 people shows a weak positive correlation between the proportion of Immigrants from Hong Kong and unemployment rate among population between the ages 25 and 29 in the United States with a correlation coefficient (R) of 0.235 and weighted average of 6.3%, a difference of 0.18%.
Unemployment Among Ages 25 to 29 years Correlation Summary
| Measurement | Palestinian | Immigrants from Hong Kong |
| Minimum | 1.7% | 1.3% |
| Maximum | 69.5% | 21.1% |
| Range | 67.8% | 19.8% |
| Mean | 7.7% | 6.6% |
| Median | 6.2% | 6.1% |
| Interquartile 25% (IQ1) | 4.9% | 5.3% |
| Interquartile 75% (IQ3) | 7.0% | 7.3% |
| Interquartile Range (IQR) | 2.2% | 2.0% |
| Standard Deviation (Sample) | 9.7% | 2.8% |
| Standard Deviation (Population) | 9.6% | 2.8% |
Demographics Similar to Palestinians and Immigrants from Hong Kong by Unemployment Among Ages 25 to 29 years
In terms of unemployment among ages 25 to 29 years, the demographic groups most similar to Palestinians are Indian (Asian) (6.3%, a difference of 0.050%), Immigrants from Northern Africa (6.3%, a difference of 0.050%), Immigrants from Lebanon (6.3%, a difference of 0.070%), Immigrants from Sri Lanka (6.3%, a difference of 0.13%), and Kenyan (6.3%, a difference of 0.18%). Similarly, the demographic groups most similar to Immigrants from Hong Kong are Immigrants from Malaysia (6.3%, a difference of 0.020%), Immigrants from France (6.3%, a difference of 0.060%), Scandinavian (6.3%, a difference of 0.080%), Indian (Asian) (6.3%, a difference of 0.23%), and Immigrants from Northern Africa (6.3%, a difference of 0.23%).
| Demographics | Rating | Rank | Unemployment Among Ages 25 to 29 years |
| Immigrants | Eastern Asia | 98.4 /100 | #58 | Exceptional 6.2% |
| Luxembourgers | 98.3 /100 | #59 | Exceptional 6.2% |
| Immigrants | Taiwan | 98.3 /100 | #60 | Exceptional 6.2% |
| Bhutanese | 98.2 /100 | #61 | Exceptional 6.2% |
| Immigrants | China | 98.1 /100 | #62 | Exceptional 6.2% |
| Kenyans | 98.0 /100 | #63 | Exceptional 6.3% |
| Immigrants | Sri Lanka | 97.9 /100 | #64 | Exceptional 6.3% |
| Immigrants | Lebanon | 97.8 /100 | #65 | Exceptional 6.3% |
| Indians (Asian) | 97.8 /100 | #66 | Exceptional 6.3% |
| Immigrants | Northern Africa | 97.8 /100 | #67 | Exceptional 6.3% |
| Palestinians | 97.7 /100 | #68 | Exceptional 6.3% |
| Immigrants | Hong Kong | 97.5 /100 | #69 | Exceptional 6.3% |
| Immigrants | Malaysia | 97.5 /100 | #70 | Exceptional 6.3% |
| Immigrants | France | 97.4 /100 | #71 | Exceptional 6.3% |
| Scandinavians | 97.4 /100 | #72 | Exceptional 6.3% |
| Belgians | 97.0 /100 | #73 | Exceptional 6.3% |
| Carpatho Rusyns | 96.9 /100 | #74 | Exceptional 6.3% |
| Immigrants | Jordan | 96.8 /100 | #75 | Exceptional 6.3% |
| Immigrants | Korea | 96.7 /100 | #76 | Exceptional 6.3% |
| Icelanders | 96.6 /100 | #77 | Exceptional 6.3% |
| Asians | 96.4 /100 | #78 | Exceptional 6.3% |