Immigrants from Bosnia and Herzegovina vs Immigrants from Hong Kong Disability
COMPARE
Immigrants from Bosnia and Herzegovina
Immigrants from Hong Kong
Disability
Disability Comparison
Immigrants from Bosnia and Herzegovina
Immigrants from Hong Kong
11.9%
DISABILITY
18.0/ 100
METRIC RATING
193rd/ 347
METRIC RANK
10.0%
DISABILITY
100.0/ 100
METRIC RATING
9th/ 347
METRIC RANK
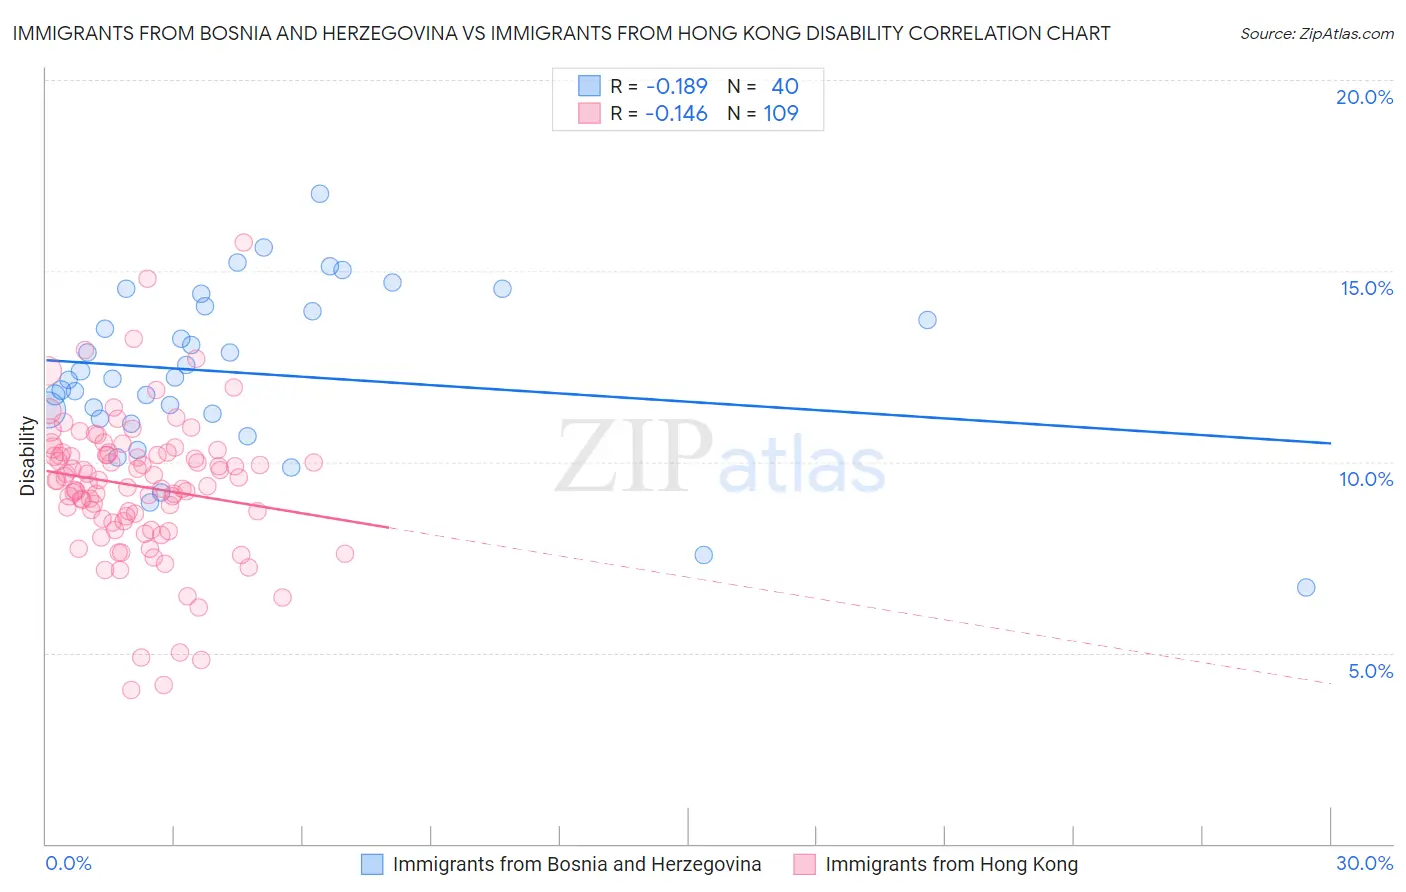
Immigrants from Bosnia and Herzegovina vs Immigrants from Hong Kong Disability Correlation Chart
The statistical analysis conducted on geographies consisting of 156,819,615 people shows a poor negative correlation between the proportion of Immigrants from Bosnia and Herzegovina and percentage of population with a disability in the United States with a correlation coefficient (R) of -0.189 and weighted average of 11.9%. Similarly, the statistical analysis conducted on geographies consisting of 253,995,136 people shows a poor negative correlation between the proportion of Immigrants from Hong Kong and percentage of population with a disability in the United States with a correlation coefficient (R) of -0.146 and weighted average of 10.0%, a difference of 18.6%.
Disability Correlation Summary
| Measurement | Immigrants from Bosnia and Herzegovina | Immigrants from Hong Kong |
| Minimum | 6.7% | 4.0% |
| Maximum | 17.0% | 15.7% |
| Range | 10.3% | 11.7% |
| Mean | 12.3% | 9.4% |
| Median | 12.2% | 9.5% |
| Interquartile 25% (IQ1) | 11.2% | 8.5% |
| Interquartile 75% (IQ3) | 14.0% | 10.2% |
| Interquartile Range (IQR) | 2.8% | 1.8% |
| Standard Deviation (Sample) | 2.2% | 1.9% |
| Standard Deviation (Population) | 2.2% | 1.9% |
Similar Demographics by Disability
Demographics Similar to Immigrants from Bosnia and Herzegovina by Disability
In terms of disability, the demographic groups most similar to Immigrants from Bosnia and Herzegovina are Lithuanian (11.9%, a difference of 0.050%), Somali (11.9%, a difference of 0.050%), Ute (11.9%, a difference of 0.10%), Barbadian (11.9%, a difference of 0.17%), and Immigrants from West Indies (11.9%, a difference of 0.21%).
| Demographics | Rating | Rank | Disability |
| Immigrants | Scotland | 28.2 /100 | #186 | Fair 11.8% |
| Lebanese | 27.9 /100 | #187 | Fair 11.8% |
| Immigrants | Mexico | 23.8 /100 | #188 | Fair 11.9% |
| Immigrants | Zaire | 21.8 /100 | #189 | Fair 11.9% |
| Immigrants | West Indies | 21.1 /100 | #190 | Fair 11.9% |
| Ute | 19.5 /100 | #191 | Poor 11.9% |
| Lithuanians | 18.8 /100 | #192 | Poor 11.9% |
| Immigrants | Bosnia and Herzegovina | 18.0 /100 | #193 | Poor 11.9% |
| Somalis | 17.3 /100 | #194 | Poor 11.9% |
| Barbadians | 15.8 /100 | #195 | Poor 11.9% |
| Serbians | 15.4 /100 | #196 | Poor 11.9% |
| Immigrants | Belize | 15.2 /100 | #197 | Poor 11.9% |
| Ukrainians | 14.7 /100 | #198 | Poor 11.9% |
| Immigrants | Panama | 14.6 /100 | #199 | Poor 11.9% |
| Belizeans | 12.8 /100 | #200 | Poor 11.9% |
Demographics Similar to Immigrants from Hong Kong by Disability
In terms of disability, the demographic groups most similar to Immigrants from Hong Kong are Bolivian (10.0%, a difference of 0.30%), Immigrants from Singapore (10.0%, a difference of 0.52%), Immigrants from China (10.1%, a difference of 0.81%), Iranian (10.1%, a difference of 0.82%), and Immigrants from South Central Asia (9.9%, a difference of 0.84%).
| Demographics | Rating | Rank | Disability |
| Filipinos | 100.0 /100 | #2 | Exceptional 9.6% |
| Immigrants | Taiwan | 100.0 /100 | #3 | Exceptional 9.6% |
| Thais | 100.0 /100 | #4 | Exceptional 9.7% |
| Immigrants | Bolivia | 100.0 /100 | #5 | Exceptional 9.9% |
| Immigrants | South Central Asia | 100.0 /100 | #6 | Exceptional 9.9% |
| Immigrants | Singapore | 100.0 /100 | #7 | Exceptional 10.0% |
| Bolivians | 100.0 /100 | #8 | Exceptional 10.0% |
| Immigrants | Hong Kong | 100.0 /100 | #9 | Exceptional 10.0% |
| Immigrants | China | 100.0 /100 | #10 | Exceptional 10.1% |
| Iranians | 100.0 /100 | #11 | Exceptional 10.1% |
| Immigrants | Israel | 100.0 /100 | #12 | Exceptional 10.1% |
| Immigrants | Eastern Asia | 100.0 /100 | #13 | Exceptional 10.2% |
| Immigrants | Korea | 100.0 /100 | #14 | Exceptional 10.2% |
| Okinawans | 100.0 /100 | #15 | Exceptional 10.3% |
| Indians (Asian) | 100.0 /100 | #16 | Exceptional 10.3% |