Native/Alaskan vs West Indian Disability Age Over 75
COMPARE
Native/Alaskan
West Indian
Disability Age Over 75
Disability Age Over 75 Comparison
Natives/Alaskans
West Indians
53.1%
DISABILITY AGE OVER 75
0.0/ 100
METRIC RATING
332nd/ 347
METRIC RANK
48.6%
DISABILITY AGE OVER 75
0.8/ 100
METRIC RATING
250th/ 347
METRIC RANK
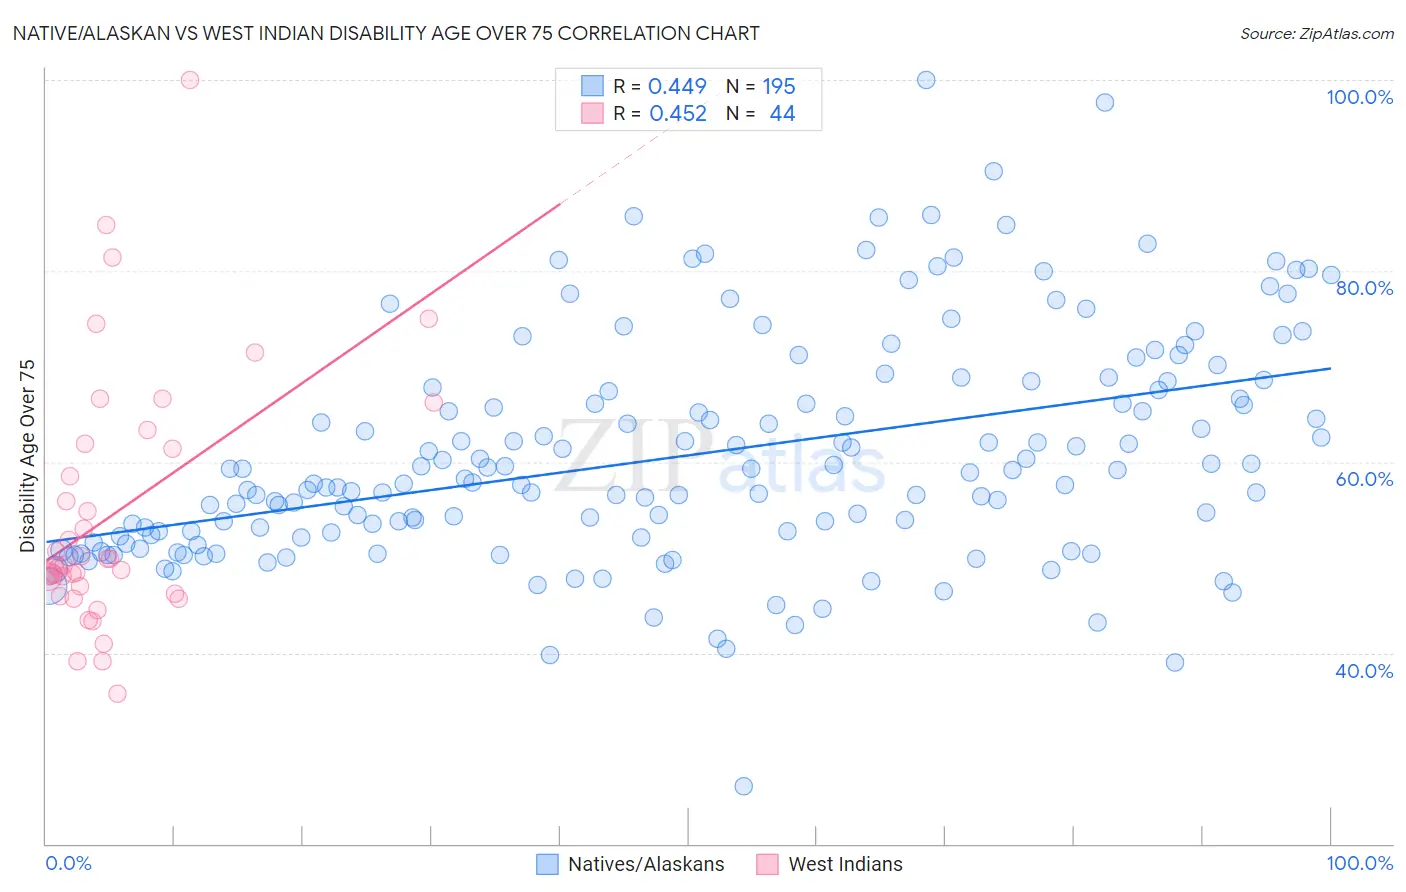
Native/Alaskan vs West Indian Disability Age Over 75 Correlation Chart
The statistical analysis conducted on geographies consisting of 511,593,286 people shows a moderate positive correlation between the proportion of Natives/Alaskans and percentage of population with a disability over the age of 75 in the United States with a correlation coefficient (R) of 0.449 and weighted average of 53.1%. Similarly, the statistical analysis conducted on geographies consisting of 253,625,945 people shows a moderate positive correlation between the proportion of West Indians and percentage of population with a disability over the age of 75 in the United States with a correlation coefficient (R) of 0.452 and weighted average of 48.6%, a difference of 9.1%.
Disability Age Over 75 Correlation Summary
| Measurement | Native/Alaskan | West Indian |
| Minimum | 26.0% | 35.7% |
| Maximum | 100.0% | 100.0% |
| Range | 74.0% | 64.3% |
| Mean | 60.6% | 54.5% |
| Median | 57.9% | 49.1% |
| Interquartile 25% (IQ1) | 52.1% | 46.6% |
| Interquartile 75% (IQ3) | 67.5% | 61.6% |
| Interquartile Range (IQR) | 15.4% | 15.0% |
| Standard Deviation (Sample) | 11.8% | 13.3% |
| Standard Deviation (Population) | 11.8% | 13.2% |
Similar Demographics by Disability Age Over 75
Demographics Similar to Natives/Alaskans by Disability Age Over 75
In terms of disability age over 75, the demographic groups most similar to Natives/Alaskans are Hopi (52.9%, a difference of 0.29%), Puerto Rican (52.9%, a difference of 0.31%), Alaska Native (52.8%, a difference of 0.49%), Choctaw (52.7%, a difference of 0.70%), and Nepalese (52.6%, a difference of 0.89%).
| Demographics | Rating | Rank | Disability Age Over 75 |
| Immigrants | Cabo Verde | 0.0 /100 | #325 | Tragic 52.4% |
| Ute | 0.0 /100 | #326 | Tragic 52.6% |
| Nepalese | 0.0 /100 | #327 | Tragic 52.6% |
| Choctaw | 0.0 /100 | #328 | Tragic 52.7% |
| Alaska Natives | 0.0 /100 | #329 | Tragic 52.8% |
| Puerto Ricans | 0.0 /100 | #330 | Tragic 52.9% |
| Hopi | 0.0 /100 | #331 | Tragic 52.9% |
| Natives/Alaskans | 0.0 /100 | #332 | Tragic 53.1% |
| Apache | 0.0 /100 | #333 | Tragic 53.6% |
| Alaskan Athabascans | 0.0 /100 | #334 | Tragic 54.0% |
| Kiowa | 0.0 /100 | #335 | Tragic 54.2% |
| Immigrants | Armenia | 0.0 /100 | #336 | Tragic 54.3% |
| Yuman | 0.0 /100 | #337 | Tragic 54.4% |
| Colville | 0.0 /100 | #338 | Tragic 55.4% |
| Pima | 0.0 /100 | #339 | Tragic 55.8% |
Demographics Similar to West Indians by Disability Age Over 75
In terms of disability age over 75, the demographic groups most similar to West Indians are Korean (48.6%, a difference of 0.020%), Iraqi (48.6%, a difference of 0.080%), Immigrants from South Eastern Asia (48.7%, a difference of 0.12%), British West Indian (48.7%, a difference of 0.16%), and Immigrants from Vietnam (48.7%, a difference of 0.20%).
| Demographics | Rating | Rank | Disability Age Over 75 |
| Immigrants | Caribbean | 2.1 /100 | #243 | Tragic 48.4% |
| Afghans | 1.8 /100 | #244 | Tragic 48.4% |
| Americans | 1.7 /100 | #245 | Tragic 48.4% |
| Chippewa | 1.6 /100 | #246 | Tragic 48.4% |
| Iroquois | 1.6 /100 | #247 | Tragic 48.4% |
| Sri Lankans | 1.4 /100 | #248 | Tragic 48.5% |
| Iraqis | 1.0 /100 | #249 | Tragic 48.6% |
| West Indians | 0.8 /100 | #250 | Tragic 48.6% |
| Koreans | 0.8 /100 | #251 | Tragic 48.6% |
| Immigrants | South Eastern Asia | 0.7 /100 | #252 | Tragic 48.7% |
| British West Indians | 0.6 /100 | #253 | Tragic 48.7% |
| Immigrants | Vietnam | 0.6 /100 | #254 | Tragic 48.7% |
| Chinese | 0.5 /100 | #255 | Tragic 48.7% |
| Immigrants | Congo | 0.5 /100 | #256 | Tragic 48.7% |
| Blackfeet | 0.5 /100 | #257 | Tragic 48.8% |