Comanche vs West Indian Disability Age Over 75
COMPARE
Comanche
West Indian
Disability Age Over 75
Disability Age Over 75 Comparison
Comanche
West Indians
51.7%
DISABILITY AGE OVER 75
0.0/ 100
METRIC RATING
322nd/ 347
METRIC RANK
48.6%
DISABILITY AGE OVER 75
0.8/ 100
METRIC RATING
250th/ 347
METRIC RANK
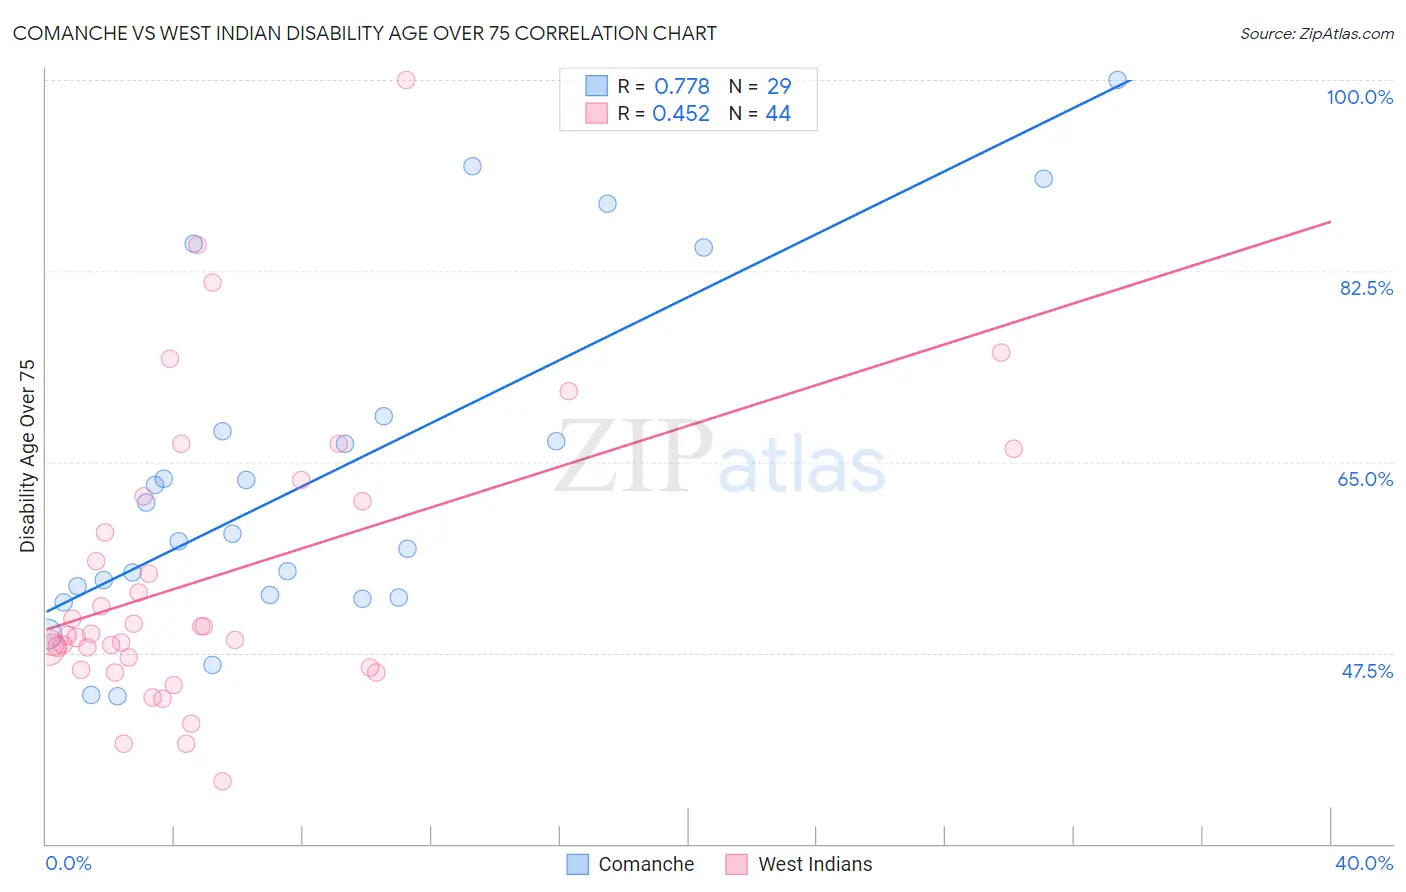
Comanche vs West Indian Disability Age Over 75 Correlation Chart
The statistical analysis conducted on geographies consisting of 109,684,350 people shows a strong positive correlation between the proportion of Comanche and percentage of population with a disability over the age of 75 in the United States with a correlation coefficient (R) of 0.778 and weighted average of 51.7%. Similarly, the statistical analysis conducted on geographies consisting of 253,625,945 people shows a moderate positive correlation between the proportion of West Indians and percentage of population with a disability over the age of 75 in the United States with a correlation coefficient (R) of 0.452 and weighted average of 48.6%, a difference of 6.4%.
Disability Age Over 75 Correlation Summary
| Measurement | Comanche | West Indian |
| Minimum | 43.6% | 35.7% |
| Maximum | 100.0% | 100.0% |
| Range | 56.4% | 64.3% |
| Mean | 63.7% | 54.5% |
| Median | 58.4% | 49.1% |
| Interquartile 25% (IQ1) | 52.7% | 46.6% |
| Interquartile 75% (IQ3) | 68.5% | 61.6% |
| Interquartile Range (IQR) | 15.8% | 15.0% |
| Standard Deviation (Sample) | 15.5% | 13.3% |
| Standard Deviation (Population) | 15.2% | 13.2% |
Similar Demographics by Disability Age Over 75
Demographics Similar to Comanche by Disability Age Over 75
In terms of disability age over 75, the demographic groups most similar to Comanche are Paiute (51.5%, a difference of 0.34%), Dutch West Indian (51.5%, a difference of 0.34%), Creek (51.5%, a difference of 0.48%), Seminole (51.5%, a difference of 0.49%), and Immigrants from Yemen (52.0%, a difference of 0.52%).
| Demographics | Rating | Rank | Disability Age Over 75 |
| Mexicans | 0.0 /100 | #315 | Tragic 51.1% |
| Chickasaw | 0.0 /100 | #316 | Tragic 51.2% |
| Yakama | 0.0 /100 | #317 | Tragic 51.3% |
| Seminole | 0.0 /100 | #318 | Tragic 51.5% |
| Creek | 0.0 /100 | #319 | Tragic 51.5% |
| Paiute | 0.0 /100 | #320 | Tragic 51.5% |
| Dutch West Indians | 0.0 /100 | #321 | Tragic 51.5% |
| Comanche | 0.0 /100 | #322 | Tragic 51.7% |
| Immigrants | Yemen | 0.0 /100 | #323 | Tragic 52.0% |
| Menominee | 0.0 /100 | #324 | Tragic 52.3% |
| Immigrants | Cabo Verde | 0.0 /100 | #325 | Tragic 52.4% |
| Ute | 0.0 /100 | #326 | Tragic 52.6% |
| Nepalese | 0.0 /100 | #327 | Tragic 52.6% |
| Choctaw | 0.0 /100 | #328 | Tragic 52.7% |
| Alaska Natives | 0.0 /100 | #329 | Tragic 52.8% |
Demographics Similar to West Indians by Disability Age Over 75
In terms of disability age over 75, the demographic groups most similar to West Indians are Korean (48.6%, a difference of 0.020%), Iraqi (48.6%, a difference of 0.080%), Immigrants from South Eastern Asia (48.7%, a difference of 0.12%), British West Indian (48.7%, a difference of 0.16%), and Immigrants from Vietnam (48.7%, a difference of 0.20%).
| Demographics | Rating | Rank | Disability Age Over 75 |
| Immigrants | Caribbean | 2.1 /100 | #243 | Tragic 48.4% |
| Afghans | 1.8 /100 | #244 | Tragic 48.4% |
| Americans | 1.7 /100 | #245 | Tragic 48.4% |
| Chippewa | 1.6 /100 | #246 | Tragic 48.4% |
| Iroquois | 1.6 /100 | #247 | Tragic 48.4% |
| Sri Lankans | 1.4 /100 | #248 | Tragic 48.5% |
| Iraqis | 1.0 /100 | #249 | Tragic 48.6% |
| West Indians | 0.8 /100 | #250 | Tragic 48.6% |
| Koreans | 0.8 /100 | #251 | Tragic 48.6% |
| Immigrants | South Eastern Asia | 0.7 /100 | #252 | Tragic 48.7% |
| British West Indians | 0.6 /100 | #253 | Tragic 48.7% |
| Immigrants | Vietnam | 0.6 /100 | #254 | Tragic 48.7% |
| Chinese | 0.5 /100 | #255 | Tragic 48.7% |
| Immigrants | Congo | 0.5 /100 | #256 | Tragic 48.7% |
| Blackfeet | 0.5 /100 | #257 | Tragic 48.8% |