Native/Alaskan vs Peruvian Disability Age Over 75
COMPARE
Native/Alaskan
Peruvian
Disability Age Over 75
Disability Age Over 75 Comparison
Natives/Alaskans
Peruvians
53.1%
DISABILITY AGE OVER 75
0.0/ 100
METRIC RATING
332nd/ 347
METRIC RANK
46.8%
DISABILITY AGE OVER 75
86.5/ 100
METRIC RATING
142nd/ 347
METRIC RANK
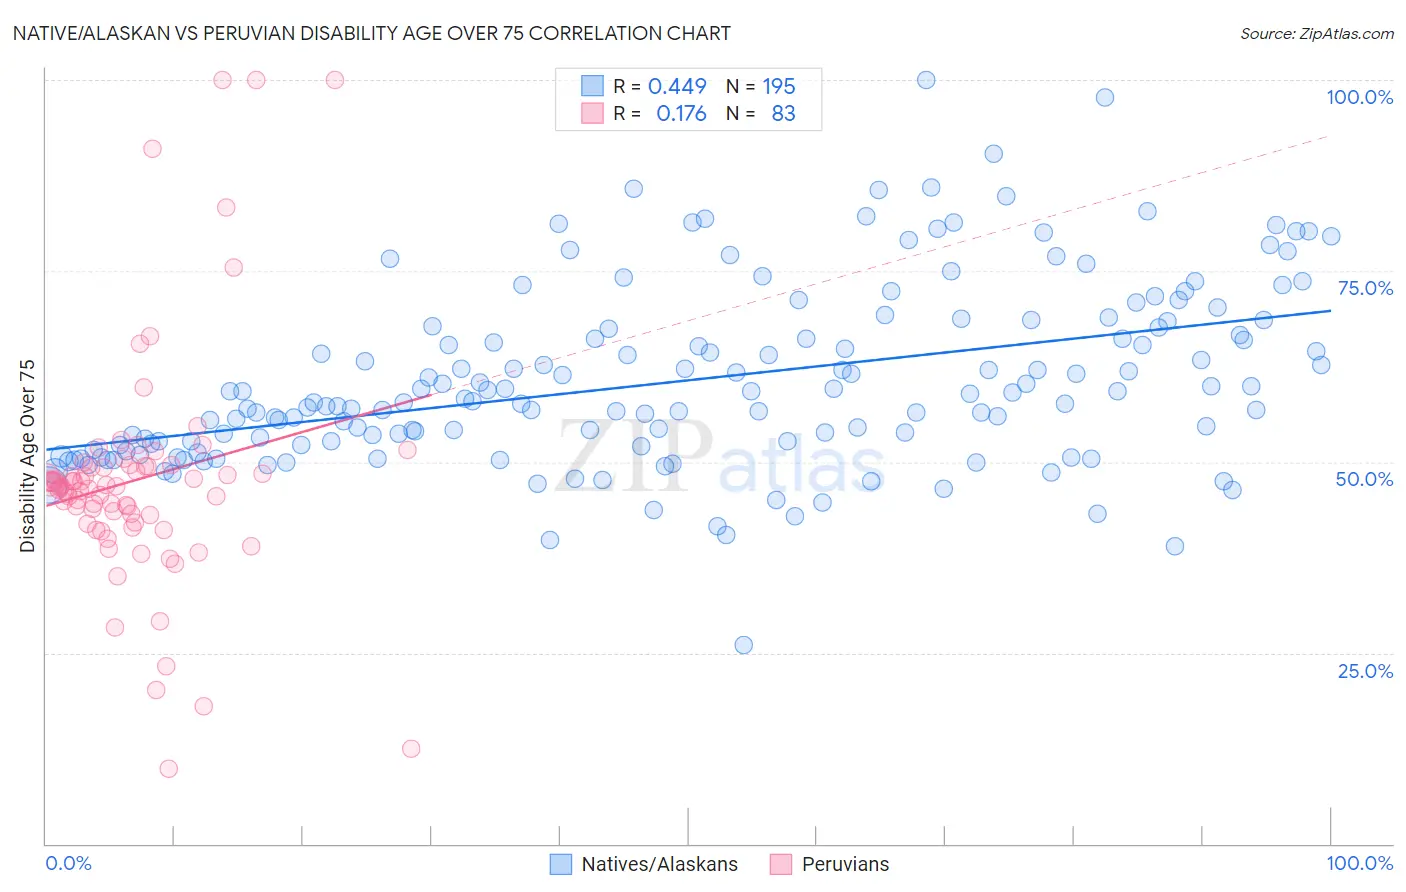
Native/Alaskan vs Peruvian Disability Age Over 75 Correlation Chart
The statistical analysis conducted on geographies consisting of 511,593,286 people shows a moderate positive correlation between the proportion of Natives/Alaskans and percentage of population with a disability over the age of 75 in the United States with a correlation coefficient (R) of 0.449 and weighted average of 53.1%. Similarly, the statistical analysis conducted on geographies consisting of 362,503,008 people shows a poor positive correlation between the proportion of Peruvians and percentage of population with a disability over the age of 75 in the United States with a correlation coefficient (R) of 0.176 and weighted average of 46.8%, a difference of 13.2%.
Disability Age Over 75 Correlation Summary
| Measurement | Native/Alaskan | Peruvian |
| Minimum | 26.0% | 9.9% |
| Maximum | 100.0% | 100.0% |
| Range | 74.0% | 90.1% |
| Mean | 60.6% | 47.6% |
| Median | 57.9% | 46.8% |
| Interquartile 25% (IQ1) | 52.1% | 42.1% |
| Interquartile 75% (IQ3) | 67.5% | 49.4% |
| Interquartile Range (IQR) | 15.4% | 7.3% |
| Standard Deviation (Sample) | 11.8% | 15.6% |
| Standard Deviation (Population) | 11.8% | 15.5% |
Similar Demographics by Disability Age Over 75
Demographics Similar to Natives/Alaskans by Disability Age Over 75
In terms of disability age over 75, the demographic groups most similar to Natives/Alaskans are Hopi (52.9%, a difference of 0.29%), Puerto Rican (52.9%, a difference of 0.31%), Alaska Native (52.8%, a difference of 0.49%), Choctaw (52.7%, a difference of 0.70%), and Nepalese (52.6%, a difference of 0.89%).
| Demographics | Rating | Rank | Disability Age Over 75 |
| Immigrants | Cabo Verde | 0.0 /100 | #325 | Tragic 52.4% |
| Ute | 0.0 /100 | #326 | Tragic 52.6% |
| Nepalese | 0.0 /100 | #327 | Tragic 52.6% |
| Choctaw | 0.0 /100 | #328 | Tragic 52.7% |
| Alaska Natives | 0.0 /100 | #329 | Tragic 52.8% |
| Puerto Ricans | 0.0 /100 | #330 | Tragic 52.9% |
| Hopi | 0.0 /100 | #331 | Tragic 52.9% |
| Natives/Alaskans | 0.0 /100 | #332 | Tragic 53.1% |
| Apache | 0.0 /100 | #333 | Tragic 53.6% |
| Alaskan Athabascans | 0.0 /100 | #334 | Tragic 54.0% |
| Kiowa | 0.0 /100 | #335 | Tragic 54.2% |
| Immigrants | Armenia | 0.0 /100 | #336 | Tragic 54.3% |
| Yuman | 0.0 /100 | #337 | Tragic 54.4% |
| Colville | 0.0 /100 | #338 | Tragic 55.4% |
| Pima | 0.0 /100 | #339 | Tragic 55.8% |
Demographics Similar to Peruvians by Disability Age Over 75
In terms of disability age over 75, the demographic groups most similar to Peruvians are Lebanese (46.8%, a difference of 0.020%), Bermudan (46.9%, a difference of 0.040%), Immigrants from Costa Rica (46.8%, a difference of 0.050%), Venezuelan (46.9%, a difference of 0.070%), and Costa Rican (46.9%, a difference of 0.090%).
| Demographics | Rating | Rank | Disability Age Over 75 |
| Ethiopians | 88.9 /100 | #135 | Excellent 46.8% |
| Immigrants | Venezuela | 88.6 /100 | #136 | Excellent 46.8% |
| Immigrants | Uganda | 88.5 /100 | #137 | Excellent 46.8% |
| Immigrants | Bosnia and Herzegovina | 88.5 /100 | #138 | Excellent 46.8% |
| Yugoslavians | 88.5 /100 | #139 | Excellent 46.8% |
| Immigrants | Costa Rica | 87.4 /100 | #140 | Excellent 46.8% |
| Lebanese | 87.0 /100 | #141 | Excellent 46.8% |
| Peruvians | 86.5 /100 | #142 | Excellent 46.8% |
| Bermudans | 85.6 /100 | #143 | Excellent 46.9% |
| Venezuelans | 85.0 /100 | #144 | Excellent 46.9% |
| Costa Ricans | 84.5 /100 | #145 | Excellent 46.9% |
| Guyanese | 84.3 /100 | #146 | Excellent 46.9% |
| Immigrants | Peru | 84.1 /100 | #147 | Excellent 46.9% |
| Asians | 81.6 /100 | #148 | Excellent 46.9% |
| Welsh | 81.3 /100 | #149 | Excellent 47.0% |