Malaysian vs West Indian Disability Age Over 75
COMPARE
Malaysian
West Indian
Disability Age Over 75
Disability Age Over 75 Comparison
Malaysians
West Indians
49.0%
DISABILITY AGE OVER 75
0.2/ 100
METRIC RATING
267th/ 347
METRIC RANK
48.6%
DISABILITY AGE OVER 75
0.8/ 100
METRIC RATING
250th/ 347
METRIC RANK
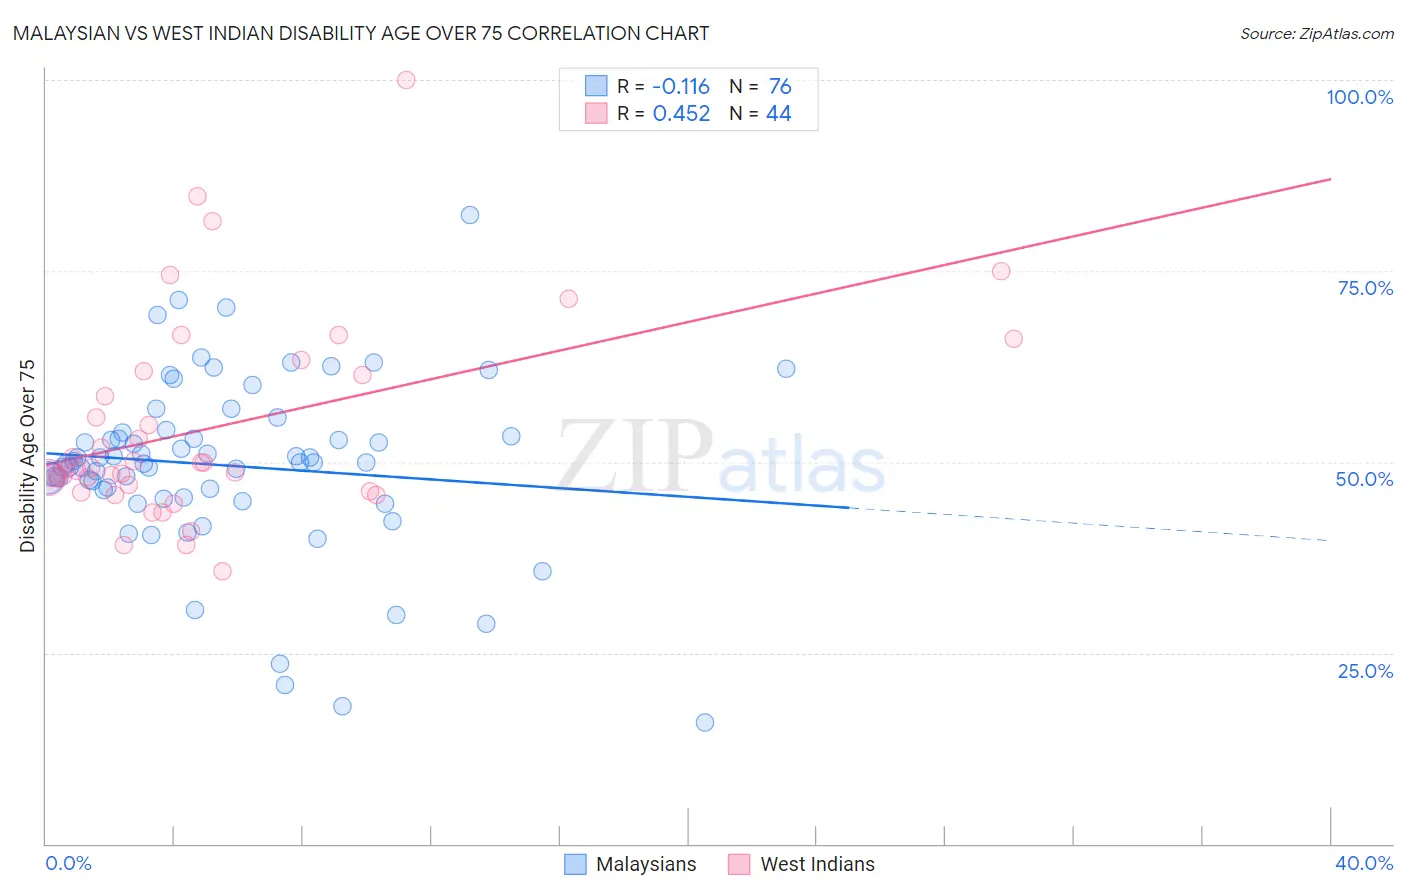
Malaysian vs West Indian Disability Age Over 75 Correlation Chart
The statistical analysis conducted on geographies consisting of 225,778,475 people shows a poor negative correlation between the proportion of Malaysians and percentage of population with a disability over the age of 75 in the United States with a correlation coefficient (R) of -0.116 and weighted average of 49.0%. Similarly, the statistical analysis conducted on geographies consisting of 253,625,945 people shows a moderate positive correlation between the proportion of West Indians and percentage of population with a disability over the age of 75 in the United States with a correlation coefficient (R) of 0.452 and weighted average of 48.6%, a difference of 0.81%.
Disability Age Over 75 Correlation Summary
| Measurement | Malaysian | West Indian |
| Minimum | 15.9% | 35.7% |
| Maximum | 82.4% | 100.0% |
| Range | 66.5% | 64.3% |
| Mean | 49.5% | 54.5% |
| Median | 50.0% | 49.1% |
| Interquartile 25% (IQ1) | 45.8% | 46.6% |
| Interquartile 75% (IQ3) | 53.6% | 61.6% |
| Interquartile Range (IQR) | 7.8% | 15.0% |
| Standard Deviation (Sample) | 11.5% | 13.3% |
| Standard Deviation (Population) | 11.4% | 13.2% |
Demographics Similar to Malaysians and West Indians by Disability Age Over 75
In terms of disability age over 75, the demographic groups most similar to Malaysians are Guatemalan (49.0%, a difference of 0.020%), U.S. Virgin Islander (48.9%, a difference of 0.13%), Honduran (48.9%, a difference of 0.16%), Immigrants from Honduras (48.9%, a difference of 0.17%), and Salvadoran (48.9%, a difference of 0.22%). Similarly, the demographic groups most similar to West Indians are Korean (48.6%, a difference of 0.020%), Iraqi (48.6%, a difference of 0.080%), Immigrants from South Eastern Asia (48.7%, a difference of 0.12%), British West Indian (48.7%, a difference of 0.16%), and Immigrants from Vietnam (48.7%, a difference of 0.20%).
| Demographics | Rating | Rank | Disability Age Over 75 |
| Sri Lankans | 1.4 /100 | #248 | Tragic 48.5% |
| Iraqis | 1.0 /100 | #249 | Tragic 48.6% |
| West Indians | 0.8 /100 | #250 | Tragic 48.6% |
| Koreans | 0.8 /100 | #251 | Tragic 48.6% |
| Immigrants | South Eastern Asia | 0.7 /100 | #252 | Tragic 48.7% |
| British West Indians | 0.6 /100 | #253 | Tragic 48.7% |
| Immigrants | Vietnam | 0.6 /100 | #254 | Tragic 48.7% |
| Chinese | 0.5 /100 | #255 | Tragic 48.7% |
| Immigrants | Congo | 0.5 /100 | #256 | Tragic 48.7% |
| Blackfeet | 0.5 /100 | #257 | Tragic 48.8% |
| Immigrants | Philippines | 0.4 /100 | #258 | Tragic 48.8% |
| Central Americans | 0.4 /100 | #259 | Tragic 48.8% |
| Immigrants | Afghanistan | 0.4 /100 | #260 | Tragic 48.8% |
| Africans | 0.3 /100 | #261 | Tragic 48.9% |
| Immigrants | West Indies | 0.3 /100 | #262 | Tragic 48.9% |
| Salvadorans | 0.3 /100 | #263 | Tragic 48.9% |
| Immigrants | Honduras | 0.3 /100 | #264 | Tragic 48.9% |
| Hondurans | 0.3 /100 | #265 | Tragic 48.9% |
| U.S. Virgin Islanders | 0.2 /100 | #266 | Tragic 48.9% |
| Malaysians | 0.2 /100 | #267 | Tragic 49.0% |
| Guatemalans | 0.2 /100 | #268 | Tragic 49.0% |