Potawatomi vs West Indian Disability Age Over 75
COMPARE
Potawatomi
West Indian
Disability Age Over 75
Disability Age Over 75 Comparison
Potawatomi
West Indians
49.0%
DISABILITY AGE OVER 75
0.2/ 100
METRIC RATING
270th/ 347
METRIC RANK
48.6%
DISABILITY AGE OVER 75
0.8/ 100
METRIC RATING
250th/ 347
METRIC RANK
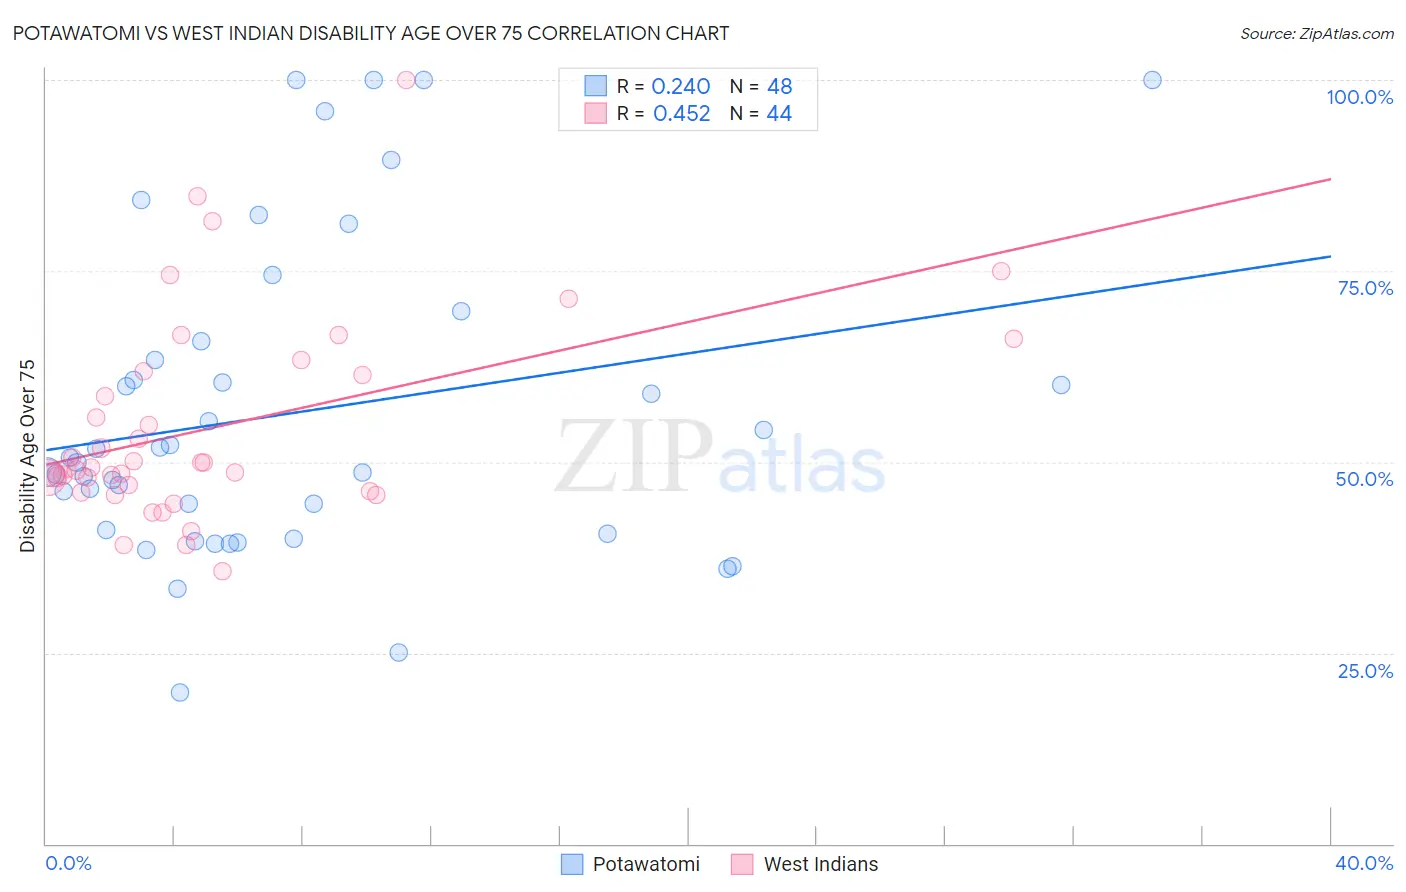
Potawatomi vs West Indian Disability Age Over 75 Correlation Chart
The statistical analysis conducted on geographies consisting of 117,704,790 people shows a weak positive correlation between the proportion of Potawatomi and percentage of population with a disability over the age of 75 in the United States with a correlation coefficient (R) of 0.240 and weighted average of 49.0%. Similarly, the statistical analysis conducted on geographies consisting of 253,625,945 people shows a moderate positive correlation between the proportion of West Indians and percentage of population with a disability over the age of 75 in the United States with a correlation coefficient (R) of 0.452 and weighted average of 48.6%, a difference of 0.88%.
Disability Age Over 75 Correlation Summary
| Measurement | Potawatomi | West Indian |
| Minimum | 19.8% | 35.7% |
| Maximum | 100.0% | 100.0% |
| Range | 80.2% | 64.3% |
| Mean | 56.5% | 54.5% |
| Median | 50.3% | 49.1% |
| Interquartile 25% (IQ1) | 40.8% | 46.6% |
| Interquartile 75% (IQ3) | 64.6% | 61.6% |
| Interquartile Range (IQR) | 23.8% | 15.0% |
| Standard Deviation (Sample) | 20.6% | 13.3% |
| Standard Deviation (Population) | 20.4% | 13.2% |
Demographics Similar to Potawatomi and West Indians by Disability Age Over 75
In terms of disability age over 75, the demographic groups most similar to Potawatomi are Immigrants from El Salvador (49.0%, a difference of 0.030%), Guatemalan (49.0%, a difference of 0.050%), Malaysian (49.0%, a difference of 0.060%), U.S. Virgin Islander (48.9%, a difference of 0.20%), and Honduran (48.9%, a difference of 0.22%). Similarly, the demographic groups most similar to West Indians are Korean (48.6%, a difference of 0.020%), Immigrants from South Eastern Asia (48.7%, a difference of 0.12%), British West Indian (48.7%, a difference of 0.16%), Immigrants from Vietnam (48.7%, a difference of 0.20%), and Chinese (48.7%, a difference of 0.23%).
| Demographics | Rating | Rank | Disability Age Over 75 |
| West Indians | 0.8 /100 | #250 | Tragic 48.6% |
| Koreans | 0.8 /100 | #251 | Tragic 48.6% |
| Immigrants | South Eastern Asia | 0.7 /100 | #252 | Tragic 48.7% |
| British West Indians | 0.6 /100 | #253 | Tragic 48.7% |
| Immigrants | Vietnam | 0.6 /100 | #254 | Tragic 48.7% |
| Chinese | 0.5 /100 | #255 | Tragic 48.7% |
| Immigrants | Congo | 0.5 /100 | #256 | Tragic 48.7% |
| Blackfeet | 0.5 /100 | #257 | Tragic 48.8% |
| Immigrants | Philippines | 0.4 /100 | #258 | Tragic 48.8% |
| Central Americans | 0.4 /100 | #259 | Tragic 48.8% |
| Immigrants | Afghanistan | 0.4 /100 | #260 | Tragic 48.8% |
| Africans | 0.3 /100 | #261 | Tragic 48.9% |
| Immigrants | West Indies | 0.3 /100 | #262 | Tragic 48.9% |
| Salvadorans | 0.3 /100 | #263 | Tragic 48.9% |
| Immigrants | Honduras | 0.3 /100 | #264 | Tragic 48.9% |
| Hondurans | 0.3 /100 | #265 | Tragic 48.9% |
| U.S. Virgin Islanders | 0.2 /100 | #266 | Tragic 48.9% |
| Malaysians | 0.2 /100 | #267 | Tragic 49.0% |
| Guatemalans | 0.2 /100 | #268 | Tragic 49.0% |
| Immigrants | El Salvador | 0.2 /100 | #269 | Tragic 49.0% |
| Potawatomi | 0.2 /100 | #270 | Tragic 49.0% |