Native/Alaskan vs Jamaican Disability Age Over 75
COMPARE
Native/Alaskan
Jamaican
Disability Age Over 75
Disability Age Over 75 Comparison
Natives/Alaskans
Jamaicans
53.1%
DISABILITY AGE OVER 75
0.0/ 100
METRIC RATING
332nd/ 347
METRIC RANK
47.7%
DISABILITY AGE OVER 75
19.0/ 100
METRIC RATING
206th/ 347
METRIC RANK
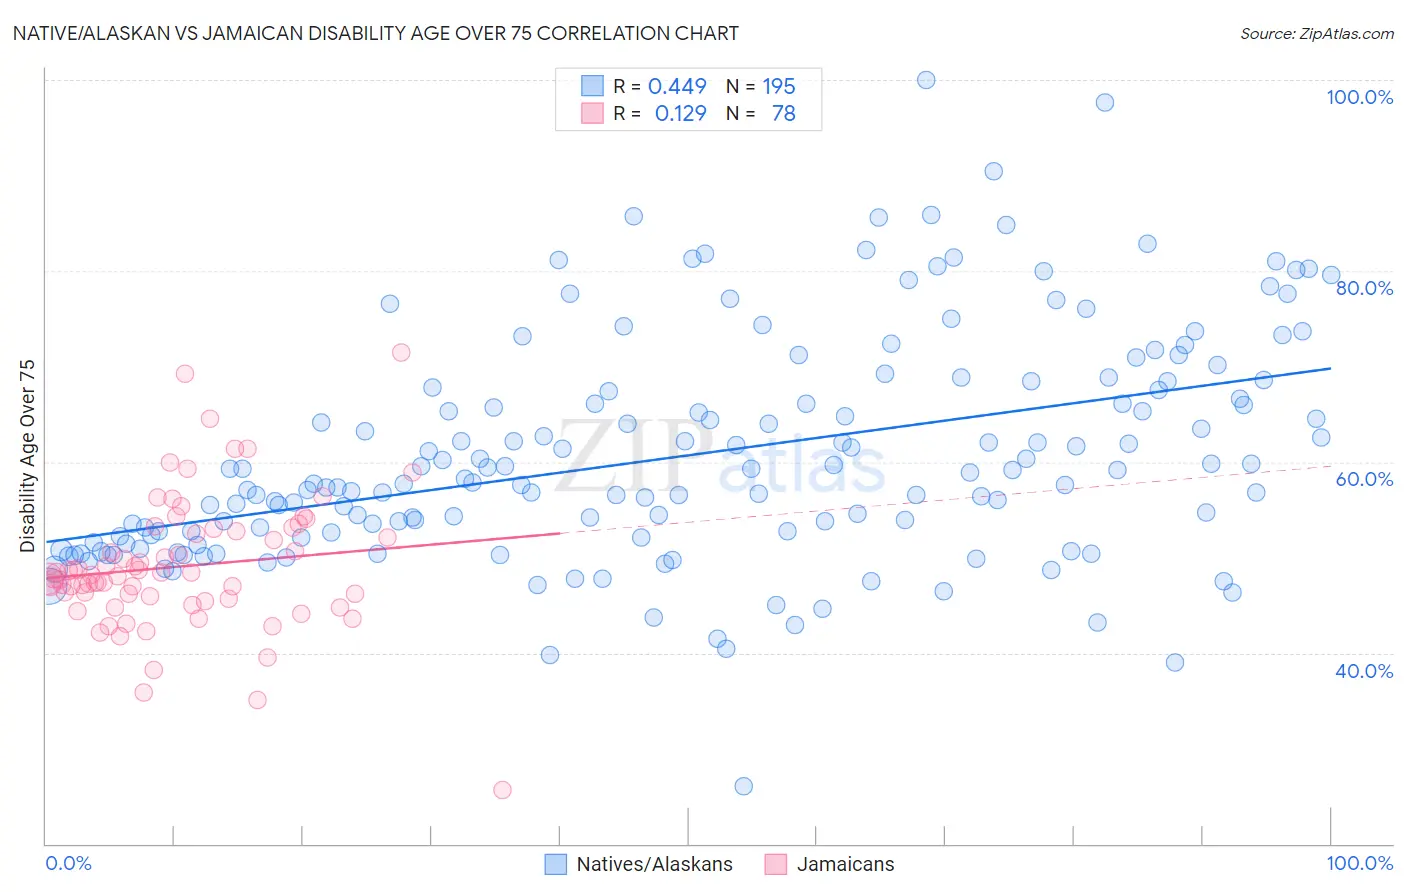
Native/Alaskan vs Jamaican Disability Age Over 75 Correlation Chart
The statistical analysis conducted on geographies consisting of 511,593,286 people shows a moderate positive correlation between the proportion of Natives/Alaskans and percentage of population with a disability over the age of 75 in the United States with a correlation coefficient (R) of 0.449 and weighted average of 53.1%. Similarly, the statistical analysis conducted on geographies consisting of 366,963,614 people shows a poor positive correlation between the proportion of Jamaicans and percentage of population with a disability over the age of 75 in the United States with a correlation coefficient (R) of 0.129 and weighted average of 47.7%, a difference of 11.2%.
Disability Age Over 75 Correlation Summary
| Measurement | Native/Alaskan | Jamaican |
| Minimum | 26.0% | 25.7% |
| Maximum | 100.0% | 71.4% |
| Range | 74.0% | 45.7% |
| Mean | 60.6% | 49.0% |
| Median | 57.9% | 48.1% |
| Interquartile 25% (IQ1) | 52.1% | 45.7% |
| Interquartile 75% (IQ3) | 67.5% | 52.8% |
| Interquartile Range (IQR) | 15.4% | 7.1% |
| Standard Deviation (Sample) | 11.8% | 7.0% |
| Standard Deviation (Population) | 11.8% | 7.0% |
Similar Demographics by Disability Age Over 75
Demographics Similar to Natives/Alaskans by Disability Age Over 75
In terms of disability age over 75, the demographic groups most similar to Natives/Alaskans are Hopi (52.9%, a difference of 0.29%), Puerto Rican (52.9%, a difference of 0.31%), Alaska Native (52.8%, a difference of 0.49%), Choctaw (52.7%, a difference of 0.70%), and Nepalese (52.6%, a difference of 0.89%).
| Demographics | Rating | Rank | Disability Age Over 75 |
| Immigrants | Cabo Verde | 0.0 /100 | #325 | Tragic 52.4% |
| Ute | 0.0 /100 | #326 | Tragic 52.6% |
| Nepalese | 0.0 /100 | #327 | Tragic 52.6% |
| Choctaw | 0.0 /100 | #328 | Tragic 52.7% |
| Alaska Natives | 0.0 /100 | #329 | Tragic 52.8% |
| Puerto Ricans | 0.0 /100 | #330 | Tragic 52.9% |
| Hopi | 0.0 /100 | #331 | Tragic 52.9% |
| Natives/Alaskans | 0.0 /100 | #332 | Tragic 53.1% |
| Apache | 0.0 /100 | #333 | Tragic 53.6% |
| Alaskan Athabascans | 0.0 /100 | #334 | Tragic 54.0% |
| Kiowa | 0.0 /100 | #335 | Tragic 54.2% |
| Immigrants | Armenia | 0.0 /100 | #336 | Tragic 54.3% |
| Yuman | 0.0 /100 | #337 | Tragic 54.4% |
| Colville | 0.0 /100 | #338 | Tragic 55.4% |
| Pima | 0.0 /100 | #339 | Tragic 55.8% |
Demographics Similar to Jamaicans by Disability Age Over 75
In terms of disability age over 75, the demographic groups most similar to Jamaicans are Immigrants from Ghana (47.7%, a difference of 0.0%), Nigerian (47.7%, a difference of 0.010%), Trinidadian and Tobagonian (47.7%, a difference of 0.040%), Immigrants from Cuba (47.7%, a difference of 0.060%), and Immigrants from Bahamas (47.7%, a difference of 0.060%).
| Demographics | Rating | Rank | Disability Age Over 75 |
| Immigrants | Eritrea | 22.4 /100 | #199 | Fair 47.7% |
| Immigrants | Somalia | 21.4 /100 | #200 | Fair 47.7% |
| Immigrants | Cuba | 20.9 /100 | #201 | Fair 47.7% |
| Immigrants | Bahamas | 20.7 /100 | #202 | Fair 47.7% |
| Trinidadians and Tobagonians | 20.0 /100 | #203 | Fair 47.7% |
| Nigerians | 19.2 /100 | #204 | Poor 47.7% |
| Immigrants | Ghana | 19.1 /100 | #205 | Poor 47.7% |
| Jamaicans | 19.0 /100 | #206 | Poor 47.7% |
| Immigrants | Syria | 17.4 /100 | #207 | Poor 47.8% |
| Immigrants | Senegal | 16.9 /100 | #208 | Poor 47.8% |
| Immigrants | Indonesia | 14.2 /100 | #209 | Poor 47.8% |
| Vietnamese | 11.9 /100 | #210 | Poor 47.9% |
| Panamanians | 11.8 /100 | #211 | Poor 47.9% |
| Immigrants | Burma/Myanmar | 11.7 /100 | #212 | Poor 47.9% |
| Laotians | 11.5 /100 | #213 | Poor 47.9% |