Native/Alaskan vs Immigrants from Canada Disability Age Over 75
COMPARE
Native/Alaskan
Immigrants from Canada
Disability Age Over 75
Disability Age Over 75 Comparison
Natives/Alaskans
Immigrants from Canada
53.1%
DISABILITY AGE OVER 75
0.0/ 100
METRIC RATING
332nd/ 347
METRIC RANK
45.7%
DISABILITY AGE OVER 75
99.8/ 100
METRIC RATING
47th/ 347
METRIC RANK
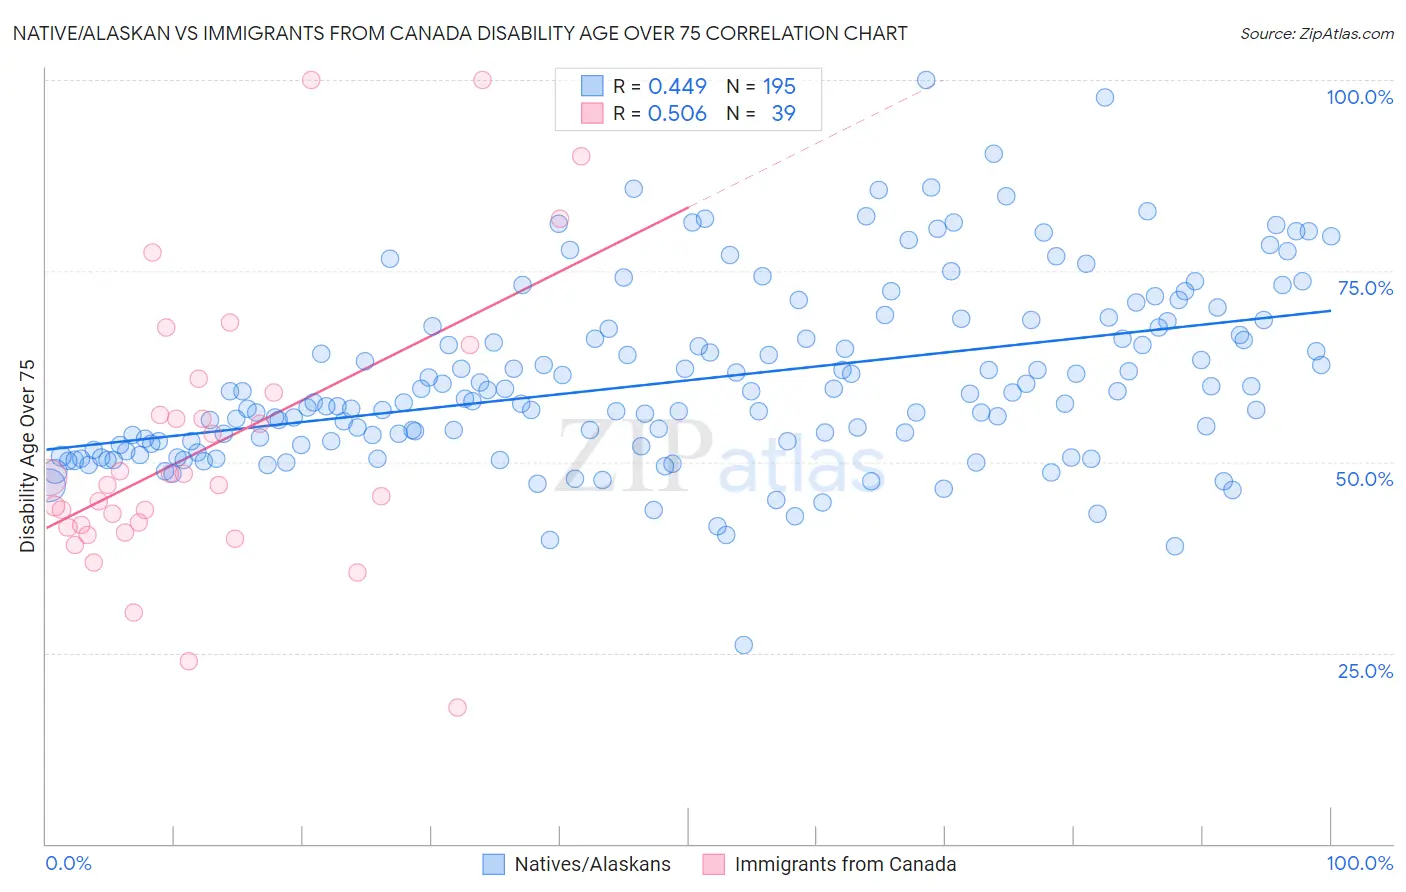
Native/Alaskan vs Immigrants from Canada Disability Age Over 75 Correlation Chart
The statistical analysis conducted on geographies consisting of 511,593,286 people shows a moderate positive correlation between the proportion of Natives/Alaskans and percentage of population with a disability over the age of 75 in the United States with a correlation coefficient (R) of 0.449 and weighted average of 53.1%. Similarly, the statistical analysis conducted on geographies consisting of 458,640,935 people shows a substantial positive correlation between the proportion of Immigrants from Canada and percentage of population with a disability over the age of 75 in the United States with a correlation coefficient (R) of 0.506 and weighted average of 45.7%, a difference of 16.1%.
Disability Age Over 75 Correlation Summary
| Measurement | Native/Alaskan | Immigrants from Canada |
| Minimum | 26.0% | 17.9% |
| Maximum | 100.0% | 100.0% |
| Range | 74.0% | 82.1% |
| Mean | 60.6% | 52.0% |
| Median | 57.9% | 47.0% |
| Interquartile 25% (IQ1) | 52.1% | 41.4% |
| Interquartile 75% (IQ3) | 67.5% | 59.1% |
| Interquartile Range (IQR) | 15.4% | 17.7% |
| Standard Deviation (Sample) | 11.8% | 18.3% |
| Standard Deviation (Population) | 11.8% | 18.1% |
Similar Demographics by Disability Age Over 75
Demographics Similar to Natives/Alaskans by Disability Age Over 75
In terms of disability age over 75, the demographic groups most similar to Natives/Alaskans are Hopi (52.9%, a difference of 0.29%), Puerto Rican (52.9%, a difference of 0.31%), Alaska Native (52.8%, a difference of 0.49%), Choctaw (52.7%, a difference of 0.70%), and Nepalese (52.6%, a difference of 0.89%).
| Demographics | Rating | Rank | Disability Age Over 75 |
| Immigrants | Cabo Verde | 0.0 /100 | #325 | Tragic 52.4% |
| Ute | 0.0 /100 | #326 | Tragic 52.6% |
| Nepalese | 0.0 /100 | #327 | Tragic 52.6% |
| Choctaw | 0.0 /100 | #328 | Tragic 52.7% |
| Alaska Natives | 0.0 /100 | #329 | Tragic 52.8% |
| Puerto Ricans | 0.0 /100 | #330 | Tragic 52.9% |
| Hopi | 0.0 /100 | #331 | Tragic 52.9% |
| Natives/Alaskans | 0.0 /100 | #332 | Tragic 53.1% |
| Apache | 0.0 /100 | #333 | Tragic 53.6% |
| Alaskan Athabascans | 0.0 /100 | #334 | Tragic 54.0% |
| Kiowa | 0.0 /100 | #335 | Tragic 54.2% |
| Immigrants | Armenia | 0.0 /100 | #336 | Tragic 54.3% |
| Yuman | 0.0 /100 | #337 | Tragic 54.4% |
| Colville | 0.0 /100 | #338 | Tragic 55.4% |
| Pima | 0.0 /100 | #339 | Tragic 55.8% |
Demographics Similar to Immigrants from Canada by Disability Age Over 75
In terms of disability age over 75, the demographic groups most similar to Immigrants from Canada are Croatian (45.7%, a difference of 0.010%), Swedish (45.7%, a difference of 0.020%), Australian (45.7%, a difference of 0.040%), Turkish (45.7%, a difference of 0.040%), and Immigrants from North America (45.7%, a difference of 0.070%).
| Demographics | Rating | Rank | Disability Age Over 75 |
| Slovenes | 99.9 /100 | #40 | Exceptional 45.6% |
| Immigrants | Singapore | 99.8 /100 | #41 | Exceptional 45.6% |
| Greeks | 99.8 /100 | #42 | Exceptional 45.6% |
| Czechs | 99.8 /100 | #43 | Exceptional 45.7% |
| Australians | 99.8 /100 | #44 | Exceptional 45.7% |
| Turks | 99.8 /100 | #45 | Exceptional 45.7% |
| Swedes | 99.8 /100 | #46 | Exceptional 45.7% |
| Immigrants | Canada | 99.8 /100 | #47 | Exceptional 45.7% |
| Croatians | 99.8 /100 | #48 | Exceptional 45.7% |
| Immigrants | North America | 99.8 /100 | #49 | Exceptional 45.7% |
| Belgians | 99.7 /100 | #50 | Exceptional 45.8% |
| Immigrants | Korea | 99.7 /100 | #51 | Exceptional 45.8% |
| Immigrants | France | 99.7 /100 | #52 | Exceptional 45.8% |
| Immigrants | Italy | 99.7 /100 | #53 | Exceptional 45.8% |
| Slovaks | 99.6 /100 | #54 | Exceptional 45.8% |