Native/Alaskan vs Immigrants from Zimbabwe Disability Age Over 75
COMPARE
Native/Alaskan
Immigrants from Zimbabwe
Disability Age Over 75
Disability Age Over 75 Comparison
Natives/Alaskans
Immigrants from Zimbabwe
53.1%
DISABILITY AGE OVER 75
0.0/ 100
METRIC RATING
332nd/ 347
METRIC RANK
47.2%
DISABILITY AGE OVER 75
64.4/ 100
METRIC RATING
165th/ 347
METRIC RANK
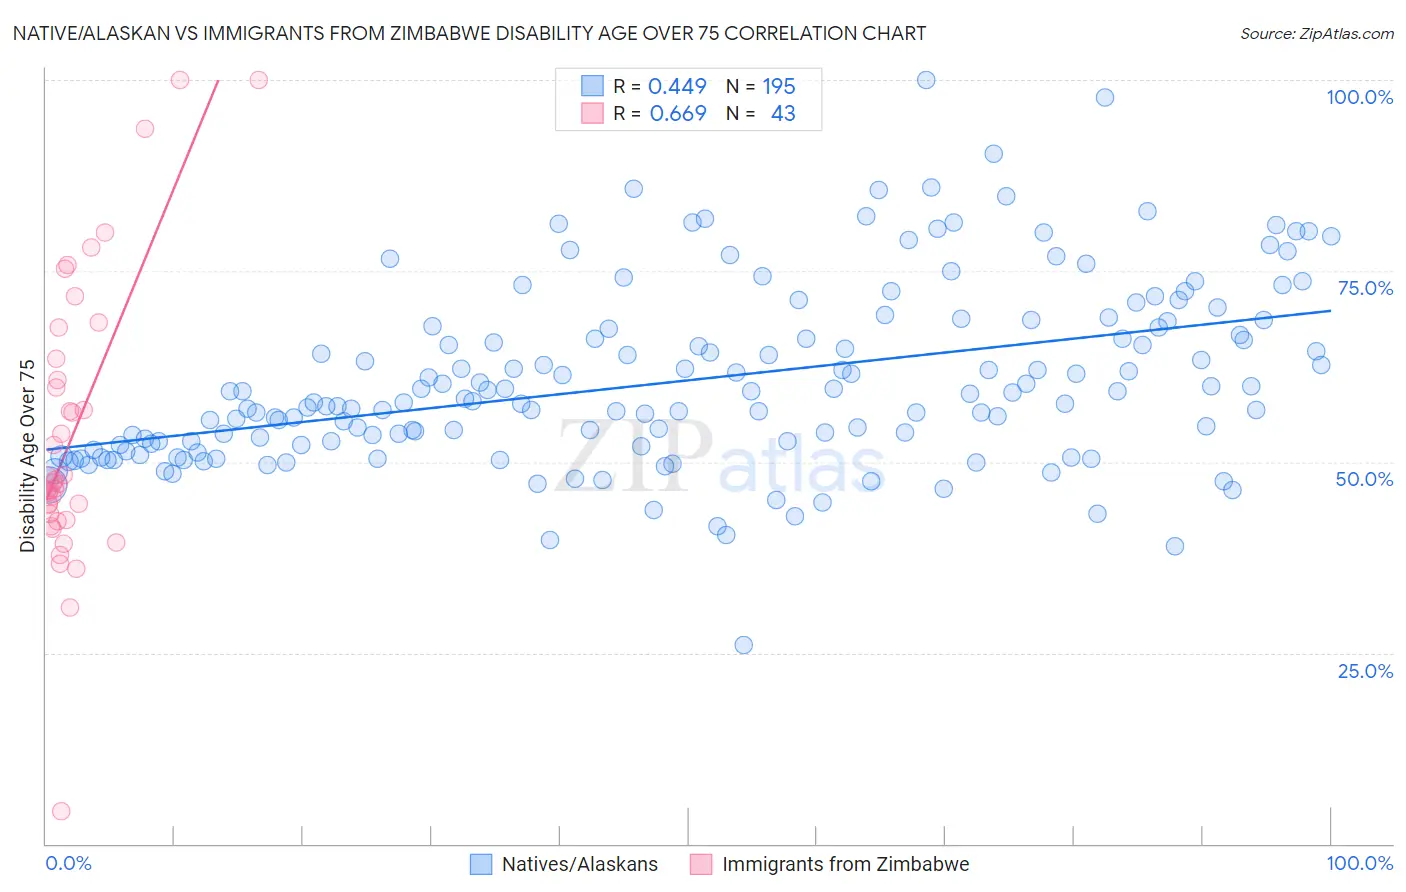
Native/Alaskan vs Immigrants from Zimbabwe Disability Age Over 75 Correlation Chart
The statistical analysis conducted on geographies consisting of 511,593,286 people shows a moderate positive correlation between the proportion of Natives/Alaskans and percentage of population with a disability over the age of 75 in the United States with a correlation coefficient (R) of 0.449 and weighted average of 53.1%. Similarly, the statistical analysis conducted on geographies consisting of 117,713,093 people shows a significant positive correlation between the proportion of Immigrants from Zimbabwe and percentage of population with a disability over the age of 75 in the United States with a correlation coefficient (R) of 0.669 and weighted average of 47.2%, a difference of 12.4%.
Disability Age Over 75 Correlation Summary
| Measurement | Native/Alaskan | Immigrants from Zimbabwe |
| Minimum | 26.0% | 4.3% |
| Maximum | 100.0% | 100.0% |
| Range | 74.0% | 95.7% |
| Mean | 60.6% | 53.7% |
| Median | 57.9% | 47.3% |
| Interquartile 25% (IQ1) | 52.1% | 42.4% |
| Interquartile 75% (IQ3) | 67.5% | 63.4% |
| Interquartile Range (IQR) | 15.4% | 21.0% |
| Standard Deviation (Sample) | 11.8% | 18.7% |
| Standard Deviation (Population) | 11.8% | 18.5% |
Similar Demographics by Disability Age Over 75
Demographics Similar to Natives/Alaskans by Disability Age Over 75
In terms of disability age over 75, the demographic groups most similar to Natives/Alaskans are Hopi (52.9%, a difference of 0.29%), Puerto Rican (52.9%, a difference of 0.31%), Alaska Native (52.8%, a difference of 0.49%), Choctaw (52.7%, a difference of 0.70%), and Nepalese (52.6%, a difference of 0.89%).
| Demographics | Rating | Rank | Disability Age Over 75 |
| Immigrants | Cabo Verde | 0.0 /100 | #325 | Tragic 52.4% |
| Ute | 0.0 /100 | #326 | Tragic 52.6% |
| Nepalese | 0.0 /100 | #327 | Tragic 52.6% |
| Choctaw | 0.0 /100 | #328 | Tragic 52.7% |
| Alaska Natives | 0.0 /100 | #329 | Tragic 52.8% |
| Puerto Ricans | 0.0 /100 | #330 | Tragic 52.9% |
| Hopi | 0.0 /100 | #331 | Tragic 52.9% |
| Natives/Alaskans | 0.0 /100 | #332 | Tragic 53.1% |
| Apache | 0.0 /100 | #333 | Tragic 53.6% |
| Alaskan Athabascans | 0.0 /100 | #334 | Tragic 54.0% |
| Kiowa | 0.0 /100 | #335 | Tragic 54.2% |
| Immigrants | Armenia | 0.0 /100 | #336 | Tragic 54.3% |
| Yuman | 0.0 /100 | #337 | Tragic 54.4% |
| Colville | 0.0 /100 | #338 | Tragic 55.4% |
| Pima | 0.0 /100 | #339 | Tragic 55.8% |
Demographics Similar to Immigrants from Zimbabwe by Disability Age Over 75
In terms of disability age over 75, the demographic groups most similar to Immigrants from Zimbabwe are French (47.2%, a difference of 0.0%), Immigrants from Sierra Leone (47.2%, a difference of 0.0%), Immigrants from Eastern Africa (47.2%, a difference of 0.030%), Pennsylvania German (47.2%, a difference of 0.040%), and Moroccan (47.2%, a difference of 0.040%).
| Demographics | Rating | Rank | Disability Age Over 75 |
| Immigrants | Guyana | 71.9 /100 | #158 | Good 47.1% |
| Immigrants | Morocco | 71.4 /100 | #159 | Good 47.1% |
| Immigrants | Middle Africa | 68.3 /100 | #160 | Good 47.1% |
| South American Indians | 68.1 /100 | #161 | Good 47.1% |
| Pennsylvania Germans | 66.0 /100 | #162 | Good 47.2% |
| Immigrants | Eastern Africa | 65.5 /100 | #163 | Good 47.2% |
| French | 64.6 /100 | #164 | Good 47.2% |
| Immigrants | Zimbabwe | 64.4 /100 | #165 | Good 47.2% |
| Immigrants | Sierra Leone | 64.4 /100 | #166 | Good 47.2% |
| Moroccans | 62.9 /100 | #167 | Good 47.2% |
| Kenyans | 58.8 /100 | #168 | Average 47.2% |
| Celtics | 58.7 /100 | #169 | Average 47.2% |
| German Russians | 56.2 /100 | #170 | Average 47.3% |
| Immigrants | Africa | 53.6 /100 | #171 | Average 47.3% |
| Scotch-Irish | 52.5 /100 | #172 | Average 47.3% |