Native/Alaskan vs Immigrants from Lithuania Disability Age Over 75
COMPARE
Native/Alaskan
Immigrants from Lithuania
Disability Age Over 75
Disability Age Over 75 Comparison
Natives/Alaskans
Immigrants from Lithuania
53.1%
DISABILITY AGE OVER 75
0.0/ 100
METRIC RATING
332nd/ 347
METRIC RANK
44.9%
DISABILITY AGE OVER 75
100.0/ 100
METRIC RATING
6th/ 347
METRIC RANK
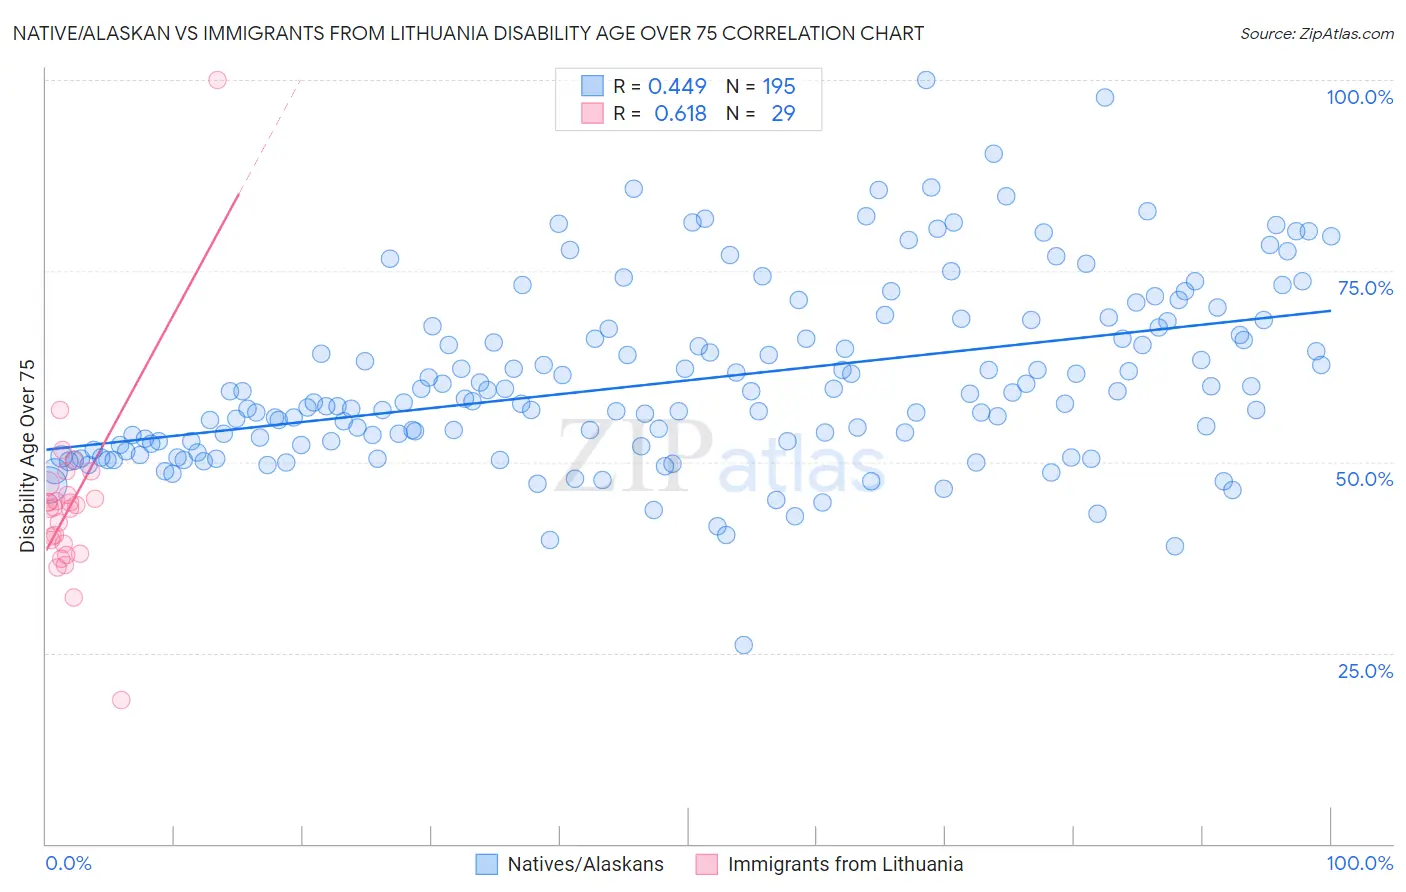
Native/Alaskan vs Immigrants from Lithuania Disability Age Over 75 Correlation Chart
The statistical analysis conducted on geographies consisting of 511,593,286 people shows a moderate positive correlation between the proportion of Natives/Alaskans and percentage of population with a disability over the age of 75 in the United States with a correlation coefficient (R) of 0.449 and weighted average of 53.1%. Similarly, the statistical analysis conducted on geographies consisting of 117,703,908 people shows a significant positive correlation between the proportion of Immigrants from Lithuania and percentage of population with a disability over the age of 75 in the United States with a correlation coefficient (R) of 0.618 and weighted average of 44.9%, a difference of 18.2%.
Disability Age Over 75 Correlation Summary
| Measurement | Native/Alaskan | Immigrants from Lithuania |
| Minimum | 26.0% | 18.8% |
| Maximum | 100.0% | 100.0% |
| Range | 74.0% | 81.2% |
| Mean | 60.6% | 44.4% |
| Median | 57.9% | 44.1% |
| Interquartile 25% (IQ1) | 52.1% | 38.6% |
| Interquartile 75% (IQ3) | 67.5% | 46.4% |
| Interquartile Range (IQR) | 15.4% | 7.8% |
| Standard Deviation (Sample) | 11.8% | 12.7% |
| Standard Deviation (Population) | 11.8% | 12.5% |
Similar Demographics by Disability Age Over 75
Demographics Similar to Natives/Alaskans by Disability Age Over 75
In terms of disability age over 75, the demographic groups most similar to Natives/Alaskans are Hopi (52.9%, a difference of 0.29%), Puerto Rican (52.9%, a difference of 0.31%), Alaska Native (52.8%, a difference of 0.49%), Choctaw (52.7%, a difference of 0.70%), and Nepalese (52.6%, a difference of 0.89%).
| Demographics | Rating | Rank | Disability Age Over 75 |
| Immigrants | Cabo Verde | 0.0 /100 | #325 | Tragic 52.4% |
| Ute | 0.0 /100 | #326 | Tragic 52.6% |
| Nepalese | 0.0 /100 | #327 | Tragic 52.6% |
| Choctaw | 0.0 /100 | #328 | Tragic 52.7% |
| Alaska Natives | 0.0 /100 | #329 | Tragic 52.8% |
| Puerto Ricans | 0.0 /100 | #330 | Tragic 52.9% |
| Hopi | 0.0 /100 | #331 | Tragic 52.9% |
| Natives/Alaskans | 0.0 /100 | #332 | Tragic 53.1% |
| Apache | 0.0 /100 | #333 | Tragic 53.6% |
| Alaskan Athabascans | 0.0 /100 | #334 | Tragic 54.0% |
| Kiowa | 0.0 /100 | #335 | Tragic 54.2% |
| Immigrants | Armenia | 0.0 /100 | #336 | Tragic 54.3% |
| Yuman | 0.0 /100 | #337 | Tragic 54.4% |
| Colville | 0.0 /100 | #338 | Tragic 55.4% |
| Pima | 0.0 /100 | #339 | Tragic 55.8% |
Demographics Similar to Immigrants from Lithuania by Disability Age Over 75
In terms of disability age over 75, the demographic groups most similar to Immigrants from Lithuania are Okinawan (44.9%, a difference of 0.040%), Luxembourger (44.8%, a difference of 0.090%), Carpatho Rusyn (44.8%, a difference of 0.15%), Immigrants from Austria (44.9%, a difference of 0.16%), and Eastern European (44.8%, a difference of 0.18%).
| Demographics | Rating | Rank | Disability Age Over 75 |
| Cypriots | 100.0 /100 | #1 | Exceptional 43.5% |
| Immigrants | Ireland | 100.0 /100 | #2 | Exceptional 44.7% |
| Eastern Europeans | 100.0 /100 | #3 | Exceptional 44.8% |
| Carpatho Rusyns | 100.0 /100 | #4 | Exceptional 44.8% |
| Luxembourgers | 100.0 /100 | #5 | Exceptional 44.8% |
| Immigrants | Lithuania | 100.0 /100 | #6 | Exceptional 44.9% |
| Okinawans | 100.0 /100 | #7 | Exceptional 44.9% |
| Immigrants | Austria | 100.0 /100 | #8 | Exceptional 44.9% |
| Paraguayans | 100.0 /100 | #9 | Exceptional 45.0% |
| Bulgarians | 100.0 /100 | #10 | Exceptional 45.1% |
| Lithuanians | 100.0 /100 | #11 | Exceptional 45.1% |
| Immigrants | Czechoslovakia | 100.0 /100 | #12 | Exceptional 45.1% |
| Latvians | 100.0 /100 | #13 | Exceptional 45.1% |
| Immigrants | Scotland | 100.0 /100 | #14 | Exceptional 45.1% |
| Immigrants | Sweden | 100.0 /100 | #15 | Exceptional 45.1% |