Native/Alaskan vs Hungarian Disability Age Over 75
COMPARE
Native/Alaskan
Hungarian
Disability Age Over 75
Disability Age Over 75 Comparison
Natives/Alaskans
Hungarians
53.1%
DISABILITY AGE OVER 75
0.0/ 100
METRIC RATING
332nd/ 347
METRIC RANK
46.5%
DISABILITY AGE OVER 75
95.3/ 100
METRIC RATING
117th/ 347
METRIC RANK
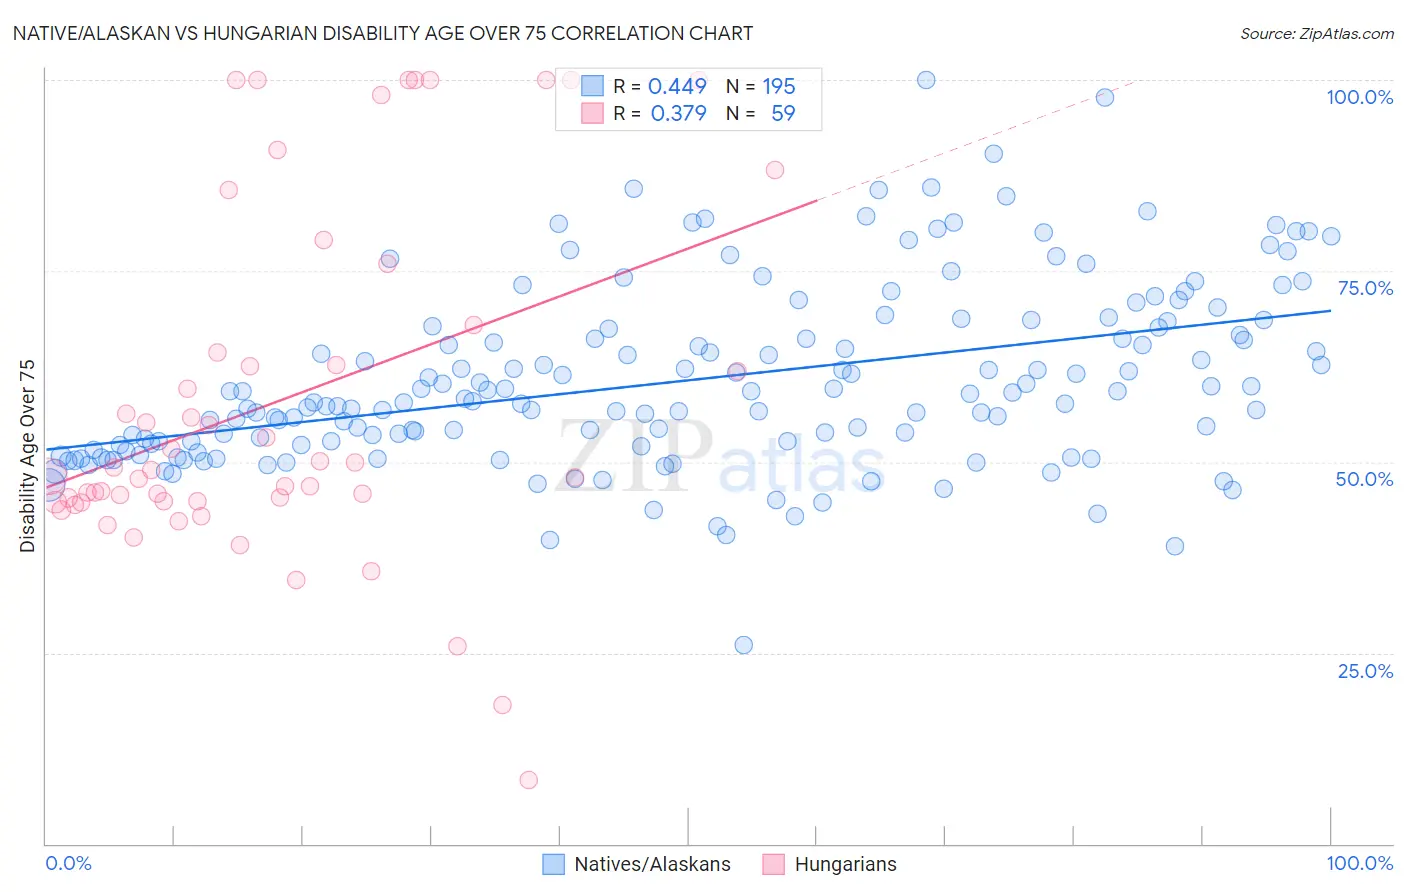
Native/Alaskan vs Hungarian Disability Age Over 75 Correlation Chart
The statistical analysis conducted on geographies consisting of 511,593,286 people shows a moderate positive correlation between the proportion of Natives/Alaskans and percentage of population with a disability over the age of 75 in the United States with a correlation coefficient (R) of 0.449 and weighted average of 53.1%. Similarly, the statistical analysis conducted on geographies consisting of 485,150,017 people shows a mild positive correlation between the proportion of Hungarians and percentage of population with a disability over the age of 75 in the United States with a correlation coefficient (R) of 0.379 and weighted average of 46.5%, a difference of 14.0%.
Disability Age Over 75 Correlation Summary
| Measurement | Native/Alaskan | Hungarian |
| Minimum | 26.0% | 8.3% |
| Maximum | 100.0% | 100.0% |
| Range | 74.0% | 91.7% |
| Mean | 60.6% | 58.0% |
| Median | 57.9% | 48.9% |
| Interquartile 25% (IQ1) | 52.1% | 44.8% |
| Interquartile 75% (IQ3) | 67.5% | 67.9% |
| Interquartile Range (IQR) | 15.4% | 23.1% |
| Standard Deviation (Sample) | 11.8% | 22.8% |
| Standard Deviation (Population) | 11.8% | 22.6% |
Similar Demographics by Disability Age Over 75
Demographics Similar to Natives/Alaskans by Disability Age Over 75
In terms of disability age over 75, the demographic groups most similar to Natives/Alaskans are Hopi (52.9%, a difference of 0.29%), Puerto Rican (52.9%, a difference of 0.31%), Alaska Native (52.8%, a difference of 0.49%), Choctaw (52.7%, a difference of 0.70%), and Nepalese (52.6%, a difference of 0.89%).
| Demographics | Rating | Rank | Disability Age Over 75 |
| Immigrants | Cabo Verde | 0.0 /100 | #325 | Tragic 52.4% |
| Ute | 0.0 /100 | #326 | Tragic 52.6% |
| Nepalese | 0.0 /100 | #327 | Tragic 52.6% |
| Choctaw | 0.0 /100 | #328 | Tragic 52.7% |
| Alaska Natives | 0.0 /100 | #329 | Tragic 52.8% |
| Puerto Ricans | 0.0 /100 | #330 | Tragic 52.9% |
| Hopi | 0.0 /100 | #331 | Tragic 52.9% |
| Natives/Alaskans | 0.0 /100 | #332 | Tragic 53.1% |
| Apache | 0.0 /100 | #333 | Tragic 53.6% |
| Alaskan Athabascans | 0.0 /100 | #334 | Tragic 54.0% |
| Kiowa | 0.0 /100 | #335 | Tragic 54.2% |
| Immigrants | Armenia | 0.0 /100 | #336 | Tragic 54.3% |
| Yuman | 0.0 /100 | #337 | Tragic 54.4% |
| Colville | 0.0 /100 | #338 | Tragic 55.4% |
| Pima | 0.0 /100 | #339 | Tragic 55.8% |
Demographics Similar to Hungarians by Disability Age Over 75
In terms of disability age over 75, the demographic groups most similar to Hungarians are British (46.5%, a difference of 0.060%), Indian (Asian) (46.5%, a difference of 0.060%), Dutch (46.5%, a difference of 0.080%), Czechoslovakian (46.6%, a difference of 0.080%), and Irish (46.5%, a difference of 0.10%).
| Demographics | Rating | Rank | Disability Age Over 75 |
| Immigrants | Hong Kong | 96.4 /100 | #110 | Exceptional 46.5% |
| Immigrants | Chile | 96.4 /100 | #111 | Exceptional 46.5% |
| Immigrants | Pakistan | 96.1 /100 | #112 | Exceptional 46.5% |
| Irish | 96.0 /100 | #113 | Exceptional 46.5% |
| Dutch | 95.9 /100 | #114 | Exceptional 46.5% |
| British | 95.7 /100 | #115 | Exceptional 46.5% |
| Indians (Asian) | 95.7 /100 | #116 | Exceptional 46.5% |
| Hungarians | 95.3 /100 | #117 | Exceptional 46.5% |
| Czechoslovakians | 94.7 /100 | #118 | Exceptional 46.6% |
| Canadians | 94.4 /100 | #119 | Exceptional 46.6% |
| Immigrants | Nepal | 94.1 /100 | #120 | Exceptional 46.6% |
| Scandinavians | 93.6 /100 | #121 | Exceptional 46.6% |
| Immigrants | Albania | 93.2 /100 | #122 | Exceptional 46.6% |
| Immigrants | Colombia | 92.6 /100 | #123 | Exceptional 46.7% |
| Immigrants | South America | 91.8 /100 | #124 | Exceptional 46.7% |