Native/Alaskan vs African Disability Age Over 75
COMPARE
Native/Alaskan
African
Disability Age Over 75
Disability Age Over 75 Comparison
Natives/Alaskans
Africans
53.1%
DISABILITY AGE OVER 75
0.0/ 100
METRIC RATING
332nd/ 347
METRIC RANK
48.9%
DISABILITY AGE OVER 75
0.3/ 100
METRIC RATING
261st/ 347
METRIC RANK
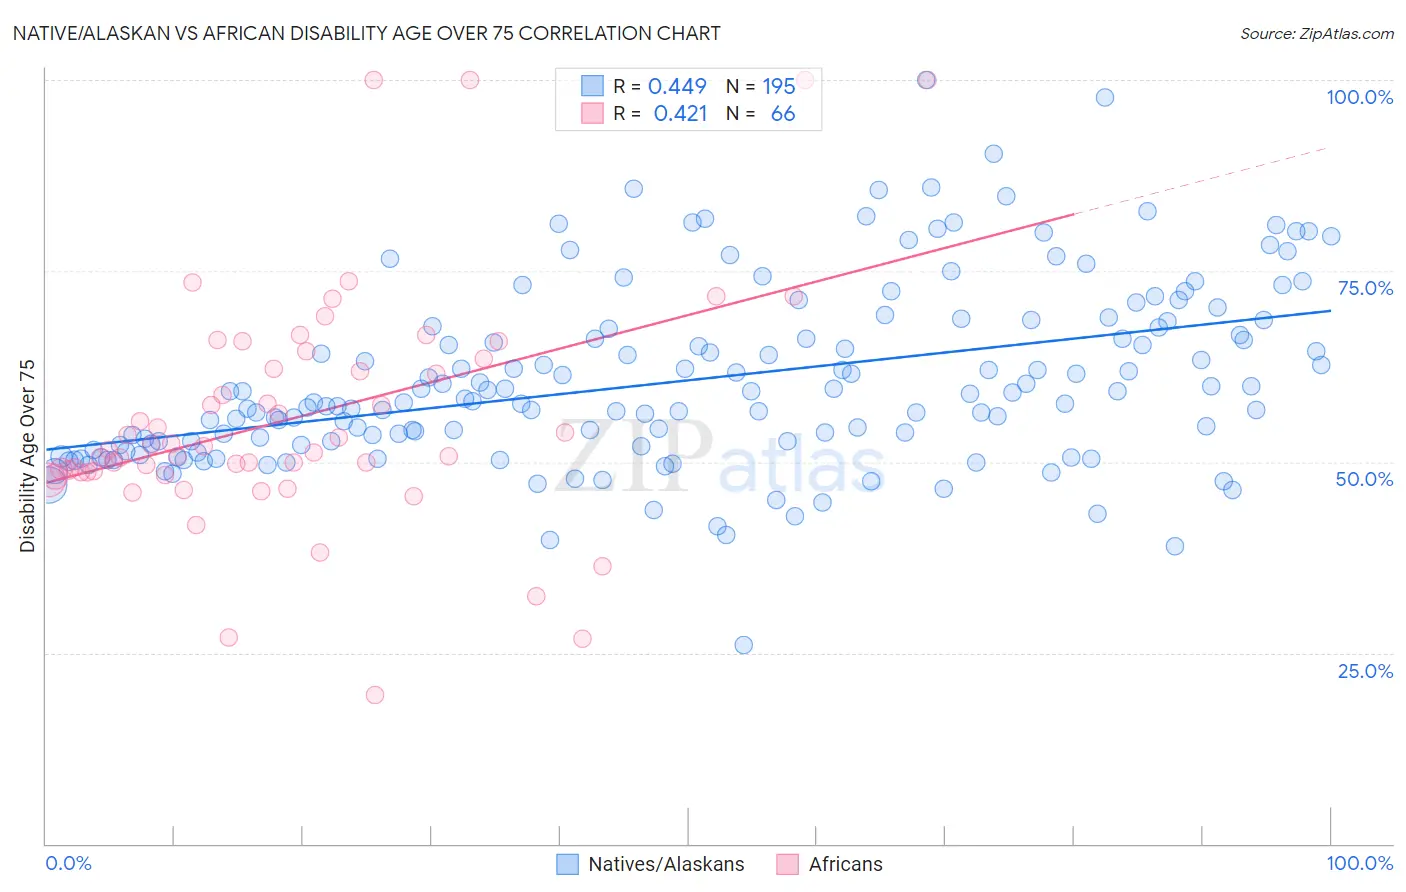
Native/Alaskan vs African Disability Age Over 75 Correlation Chart
The statistical analysis conducted on geographies consisting of 511,593,286 people shows a moderate positive correlation between the proportion of Natives/Alaskans and percentage of population with a disability over the age of 75 in the United States with a correlation coefficient (R) of 0.449 and weighted average of 53.1%. Similarly, the statistical analysis conducted on geographies consisting of 468,767,757 people shows a moderate positive correlation between the proportion of Africans and percentage of population with a disability over the age of 75 in the United States with a correlation coefficient (R) of 0.421 and weighted average of 48.9%, a difference of 8.6%.
Disability Age Over 75 Correlation Summary
| Measurement | Native/Alaskan | African |
| Minimum | 26.0% | 19.4% |
| Maximum | 100.0% | 100.0% |
| Range | 74.0% | 80.6% |
| Mean | 60.6% | 55.8% |
| Median | 57.9% | 51.8% |
| Interquartile 25% (IQ1) | 52.1% | 48.7% |
| Interquartile 75% (IQ3) | 67.5% | 63.5% |
| Interquartile Range (IQR) | 15.4% | 14.9% |
| Standard Deviation (Sample) | 11.8% | 15.7% |
| Standard Deviation (Population) | 11.8% | 15.5% |
Similar Demographics by Disability Age Over 75
Demographics Similar to Natives/Alaskans by Disability Age Over 75
In terms of disability age over 75, the demographic groups most similar to Natives/Alaskans are Hopi (52.9%, a difference of 0.29%), Puerto Rican (52.9%, a difference of 0.31%), Alaska Native (52.8%, a difference of 0.49%), Choctaw (52.7%, a difference of 0.70%), and Nepalese (52.6%, a difference of 0.89%).
| Demographics | Rating | Rank | Disability Age Over 75 |
| Immigrants | Cabo Verde | 0.0 /100 | #325 | Tragic 52.4% |
| Ute | 0.0 /100 | #326 | Tragic 52.6% |
| Nepalese | 0.0 /100 | #327 | Tragic 52.6% |
| Choctaw | 0.0 /100 | #328 | Tragic 52.7% |
| Alaska Natives | 0.0 /100 | #329 | Tragic 52.8% |
| Puerto Ricans | 0.0 /100 | #330 | Tragic 52.9% |
| Hopi | 0.0 /100 | #331 | Tragic 52.9% |
| Natives/Alaskans | 0.0 /100 | #332 | Tragic 53.1% |
| Apache | 0.0 /100 | #333 | Tragic 53.6% |
| Alaskan Athabascans | 0.0 /100 | #334 | Tragic 54.0% |
| Kiowa | 0.0 /100 | #335 | Tragic 54.2% |
| Immigrants | Armenia | 0.0 /100 | #336 | Tragic 54.3% |
| Yuman | 0.0 /100 | #337 | Tragic 54.4% |
| Colville | 0.0 /100 | #338 | Tragic 55.4% |
| Pima | 0.0 /100 | #339 | Tragic 55.8% |
Demographics Similar to Africans by Disability Age Over 75
In terms of disability age over 75, the demographic groups most similar to Africans are Immigrants from Afghanistan (48.8%, a difference of 0.060%), Immigrants from West Indies (48.9%, a difference of 0.060%), Salvadoran (48.9%, a difference of 0.080%), Central American (48.8%, a difference of 0.10%), and Immigrants from Honduras (48.9%, a difference of 0.13%).
| Demographics | Rating | Rank | Disability Age Over 75 |
| Immigrants | Vietnam | 0.6 /100 | #254 | Tragic 48.7% |
| Chinese | 0.5 /100 | #255 | Tragic 48.7% |
| Immigrants | Congo | 0.5 /100 | #256 | Tragic 48.7% |
| Blackfeet | 0.5 /100 | #257 | Tragic 48.8% |
| Immigrants | Philippines | 0.4 /100 | #258 | Tragic 48.8% |
| Central Americans | 0.4 /100 | #259 | Tragic 48.8% |
| Immigrants | Afghanistan | 0.4 /100 | #260 | Tragic 48.8% |
| Africans | 0.3 /100 | #261 | Tragic 48.9% |
| Immigrants | West Indies | 0.3 /100 | #262 | Tragic 48.9% |
| Salvadorans | 0.3 /100 | #263 | Tragic 48.9% |
| Immigrants | Honduras | 0.3 /100 | #264 | Tragic 48.9% |
| Hondurans | 0.3 /100 | #265 | Tragic 48.9% |
| U.S. Virgin Islanders | 0.2 /100 | #266 | Tragic 48.9% |
| Malaysians | 0.2 /100 | #267 | Tragic 49.0% |
| Guatemalans | 0.2 /100 | #268 | Tragic 49.0% |