Native/Alaskan vs Ottawa Disability Age Over 75
COMPARE
Native/Alaskan
Ottawa
Disability Age Over 75
Disability Age Over 75 Comparison
Natives/Alaskans
Ottawa
53.1%
DISABILITY AGE OVER 75
0.0/ 100
METRIC RATING
332nd/ 347
METRIC RANK
47.6%
DISABILITY AGE OVER 75
28.1/ 100
METRIC RATING
193rd/ 347
METRIC RANK
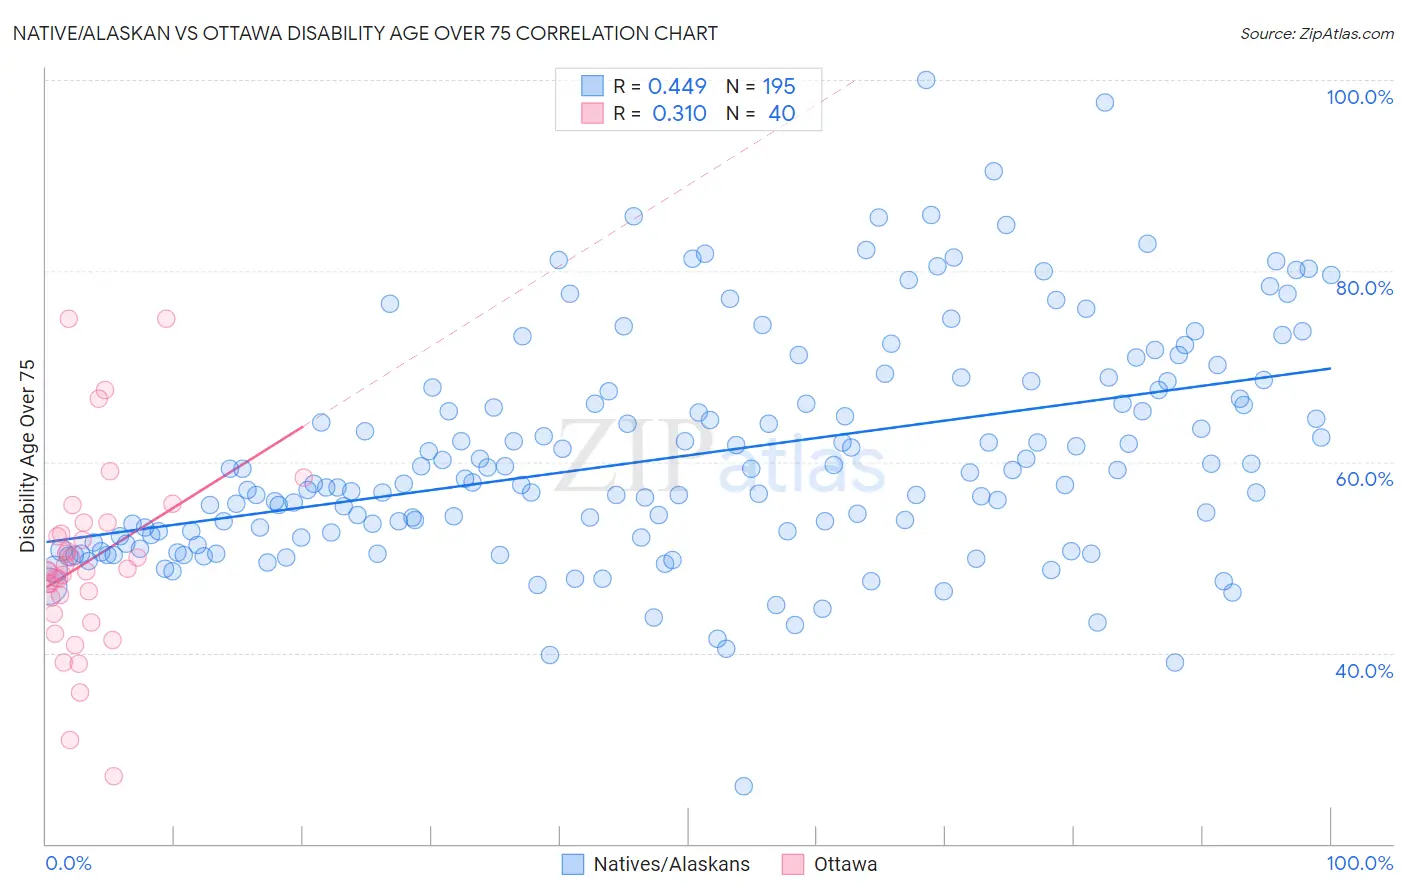
Native/Alaskan vs Ottawa Disability Age Over 75 Correlation Chart
The statistical analysis conducted on geographies consisting of 511,593,286 people shows a moderate positive correlation between the proportion of Natives/Alaskans and percentage of population with a disability over the age of 75 in the United States with a correlation coefficient (R) of 0.449 and weighted average of 53.1%. Similarly, the statistical analysis conducted on geographies consisting of 49,925,299 people shows a mild positive correlation between the proportion of Ottawa and percentage of population with a disability over the age of 75 in the United States with a correlation coefficient (R) of 0.310 and weighted average of 47.6%, a difference of 11.5%.
Disability Age Over 75 Correlation Summary
| Measurement | Native/Alaskan | Ottawa |
| Minimum | 26.0% | 27.1% |
| Maximum | 100.0% | 75.0% |
| Range | 74.0% | 47.9% |
| Mean | 60.6% | 49.5% |
| Median | 57.9% | 48.6% |
| Interquartile 25% (IQ1) | 52.1% | 44.9% |
| Interquartile 75% (IQ3) | 67.5% | 53.0% |
| Interquartile Range (IQR) | 15.4% | 8.1% |
| Standard Deviation (Sample) | 11.8% | 9.9% |
| Standard Deviation (Population) | 11.8% | 9.7% |
Similar Demographics by Disability Age Over 75
Demographics Similar to Natives/Alaskans by Disability Age Over 75
In terms of disability age over 75, the demographic groups most similar to Natives/Alaskans are Hopi (52.9%, a difference of 0.29%), Puerto Rican (52.9%, a difference of 0.31%), Alaska Native (52.8%, a difference of 0.49%), Choctaw (52.7%, a difference of 0.70%), and Nepalese (52.6%, a difference of 0.89%).
| Demographics | Rating | Rank | Disability Age Over 75 |
| Immigrants | Cabo Verde | 0.0 /100 | #325 | Tragic 52.4% |
| Ute | 0.0 /100 | #326 | Tragic 52.6% |
| Nepalese | 0.0 /100 | #327 | Tragic 52.6% |
| Choctaw | 0.0 /100 | #328 | Tragic 52.7% |
| Alaska Natives | 0.0 /100 | #329 | Tragic 52.8% |
| Puerto Ricans | 0.0 /100 | #330 | Tragic 52.9% |
| Hopi | 0.0 /100 | #331 | Tragic 52.9% |
| Natives/Alaskans | 0.0 /100 | #332 | Tragic 53.1% |
| Apache | 0.0 /100 | #333 | Tragic 53.6% |
| Alaskan Athabascans | 0.0 /100 | #334 | Tragic 54.0% |
| Kiowa | 0.0 /100 | #335 | Tragic 54.2% |
| Immigrants | Armenia | 0.0 /100 | #336 | Tragic 54.3% |
| Yuman | 0.0 /100 | #337 | Tragic 54.4% |
| Colville | 0.0 /100 | #338 | Tragic 55.4% |
| Pima | 0.0 /100 | #339 | Tragic 55.8% |
Demographics Similar to Ottawa by Disability Age Over 75
In terms of disability age over 75, the demographic groups most similar to Ottawa are Immigrants from Jamaica (47.6%, a difference of 0.0%), Portuguese (47.6%, a difference of 0.030%), Somali (47.6%, a difference of 0.040%), Immigrants from Lebanon (47.6%, a difference of 0.050%), and Basque (47.6%, a difference of 0.070%).
| Demographics | Rating | Rank | Disability Age Over 75 |
| Sudanese | 32.0 /100 | #186 | Fair 47.5% |
| Immigrants | Sudan | 31.8 /100 | #187 | Fair 47.5% |
| Basques | 30.9 /100 | #188 | Fair 47.6% |
| Immigrants | Kenya | 30.8 /100 | #189 | Fair 47.6% |
| Somalis | 29.5 /100 | #190 | Fair 47.6% |
| Portuguese | 29.3 /100 | #191 | Fair 47.6% |
| Immigrants | Jamaica | 28.3 /100 | #192 | Fair 47.6% |
| Ottawa | 28.1 /100 | #193 | Fair 47.6% |
| Immigrants | Lebanon | 26.5 /100 | #194 | Fair 47.6% |
| Immigrants | Trinidad and Tobago | 25.3 /100 | #195 | Fair 47.6% |
| Immigrants | Portugal | 23.8 /100 | #196 | Fair 47.6% |
| Pakistanis | 23.4 /100 | #197 | Fair 47.7% |
| Immigrants | Ukraine | 23.2 /100 | #198 | Fair 47.7% |
| Immigrants | Eritrea | 22.4 /100 | #199 | Fair 47.7% |
| Immigrants | Somalia | 21.4 /100 | #200 | Fair 47.7% |