Immigrants from Lithuania vs West Indian Disability Age Over 75
COMPARE
Immigrants from Lithuania
West Indian
Disability Age Over 75
Disability Age Over 75 Comparison
Immigrants from Lithuania
West Indians
44.9%
DISABILITY AGE OVER 75
100.0/ 100
METRIC RATING
6th/ 347
METRIC RANK
48.6%
DISABILITY AGE OVER 75
0.8/ 100
METRIC RATING
250th/ 347
METRIC RANK
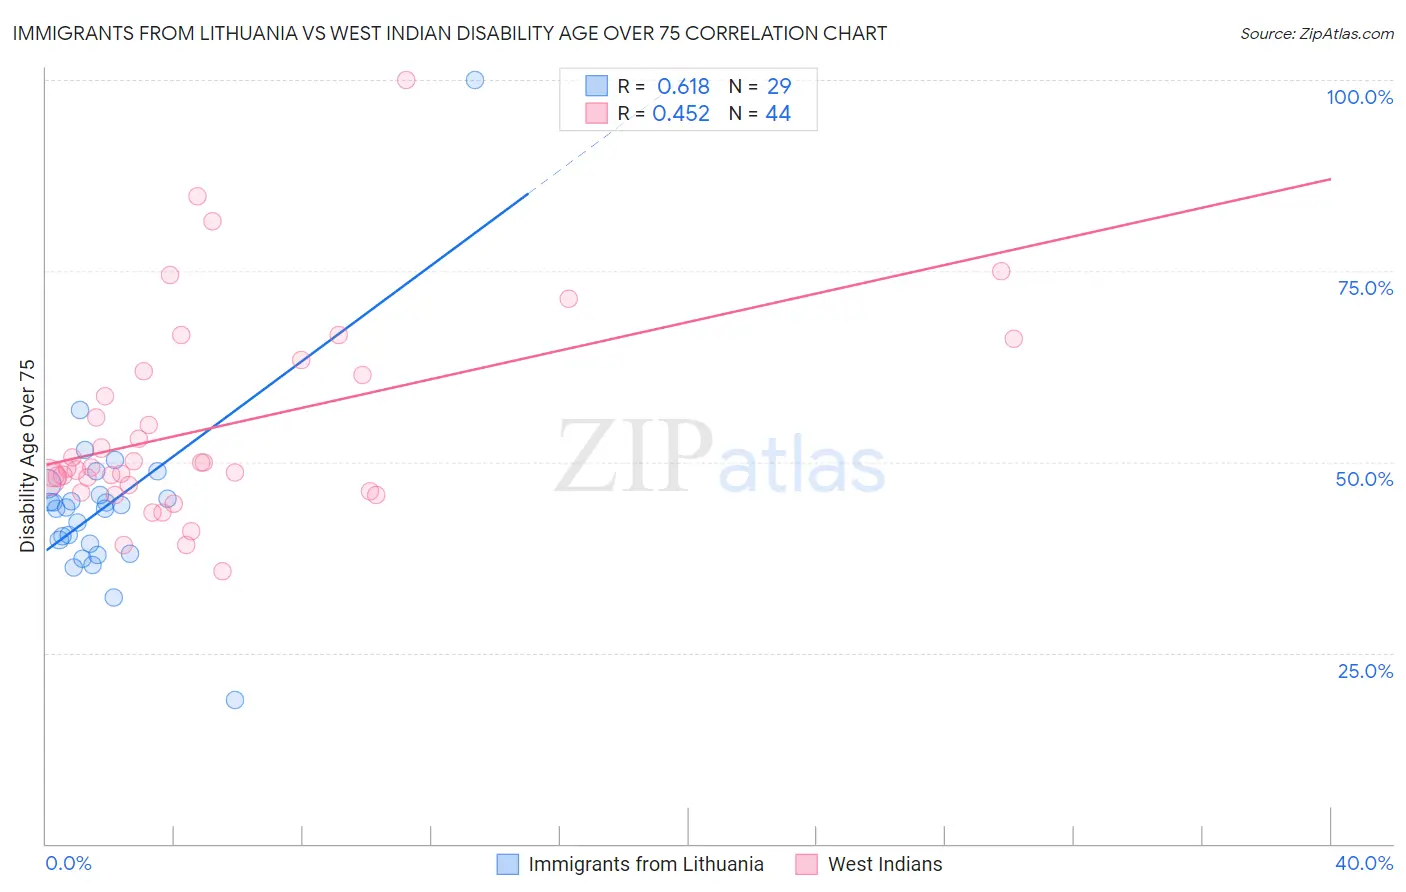
Immigrants from Lithuania vs West Indian Disability Age Over 75 Correlation Chart
The statistical analysis conducted on geographies consisting of 117,703,908 people shows a significant positive correlation between the proportion of Immigrants from Lithuania and percentage of population with a disability over the age of 75 in the United States with a correlation coefficient (R) of 0.618 and weighted average of 44.9%. Similarly, the statistical analysis conducted on geographies consisting of 253,625,945 people shows a moderate positive correlation between the proportion of West Indians and percentage of population with a disability over the age of 75 in the United States with a correlation coefficient (R) of 0.452 and weighted average of 48.6%, a difference of 8.3%.
Disability Age Over 75 Correlation Summary
| Measurement | Immigrants from Lithuania | West Indian |
| Minimum | 18.8% | 35.7% |
| Maximum | 100.0% | 100.0% |
| Range | 81.2% | 64.3% |
| Mean | 44.4% | 54.5% |
| Median | 44.1% | 49.1% |
| Interquartile 25% (IQ1) | 38.6% | 46.6% |
| Interquartile 75% (IQ3) | 46.4% | 61.6% |
| Interquartile Range (IQR) | 7.8% | 15.0% |
| Standard Deviation (Sample) | 12.7% | 13.3% |
| Standard Deviation (Population) | 12.5% | 13.2% |
Similar Demographics by Disability Age Over 75
Demographics Similar to Immigrants from Lithuania by Disability Age Over 75
In terms of disability age over 75, the demographic groups most similar to Immigrants from Lithuania are Okinawan (44.9%, a difference of 0.040%), Luxembourger (44.8%, a difference of 0.090%), Carpatho Rusyn (44.8%, a difference of 0.15%), Immigrants from Austria (44.9%, a difference of 0.16%), and Eastern European (44.8%, a difference of 0.18%).
| Demographics | Rating | Rank | Disability Age Over 75 |
| Cypriots | 100.0 /100 | #1 | Exceptional 43.5% |
| Immigrants | Ireland | 100.0 /100 | #2 | Exceptional 44.7% |
| Eastern Europeans | 100.0 /100 | #3 | Exceptional 44.8% |
| Carpatho Rusyns | 100.0 /100 | #4 | Exceptional 44.8% |
| Luxembourgers | 100.0 /100 | #5 | Exceptional 44.8% |
| Immigrants | Lithuania | 100.0 /100 | #6 | Exceptional 44.9% |
| Okinawans | 100.0 /100 | #7 | Exceptional 44.9% |
| Immigrants | Austria | 100.0 /100 | #8 | Exceptional 44.9% |
| Paraguayans | 100.0 /100 | #9 | Exceptional 45.0% |
| Bulgarians | 100.0 /100 | #10 | Exceptional 45.1% |
| Lithuanians | 100.0 /100 | #11 | Exceptional 45.1% |
| Immigrants | Czechoslovakia | 100.0 /100 | #12 | Exceptional 45.1% |
| Latvians | 100.0 /100 | #13 | Exceptional 45.1% |
| Immigrants | Scotland | 100.0 /100 | #14 | Exceptional 45.1% |
| Immigrants | Sweden | 100.0 /100 | #15 | Exceptional 45.1% |
Demographics Similar to West Indians by Disability Age Over 75
In terms of disability age over 75, the demographic groups most similar to West Indians are Korean (48.6%, a difference of 0.020%), Iraqi (48.6%, a difference of 0.080%), Immigrants from South Eastern Asia (48.7%, a difference of 0.12%), British West Indian (48.7%, a difference of 0.16%), and Immigrants from Vietnam (48.7%, a difference of 0.20%).
| Demographics | Rating | Rank | Disability Age Over 75 |
| Immigrants | Caribbean | 2.1 /100 | #243 | Tragic 48.4% |
| Afghans | 1.8 /100 | #244 | Tragic 48.4% |
| Americans | 1.7 /100 | #245 | Tragic 48.4% |
| Chippewa | 1.6 /100 | #246 | Tragic 48.4% |
| Iroquois | 1.6 /100 | #247 | Tragic 48.4% |
| Sri Lankans | 1.4 /100 | #248 | Tragic 48.5% |
| Iraqis | 1.0 /100 | #249 | Tragic 48.6% |
| West Indians | 0.8 /100 | #250 | Tragic 48.6% |
| Koreans | 0.8 /100 | #251 | Tragic 48.6% |
| Immigrants | South Eastern Asia | 0.7 /100 | #252 | Tragic 48.7% |
| British West Indians | 0.6 /100 | #253 | Tragic 48.7% |
| Immigrants | Vietnam | 0.6 /100 | #254 | Tragic 48.7% |
| Chinese | 0.5 /100 | #255 | Tragic 48.7% |
| Immigrants | Congo | 0.5 /100 | #256 | Tragic 48.7% |
| Blackfeet | 0.5 /100 | #257 | Tragic 48.8% |